Predicting the stock market based on public sentiment on Hacker News
2.1.3 Common methods and techniques
2.2 Challenges of sentiment analysis
2.3 The potential of niche forums
2.3.1 Hacker News: A Unique Data Source
4.1 Determining periods of volatility
5.1.1 Confidence scoring and sample selection
5.2 Evaluation of feature representation methods
5.2.2 Effect on Sentiment Analysis31
5.2.3 Choice of feature representation32
5.3 Comparison of model performance34
7.1 Sentiment analysis results
A. Figures used in determining volatile periods
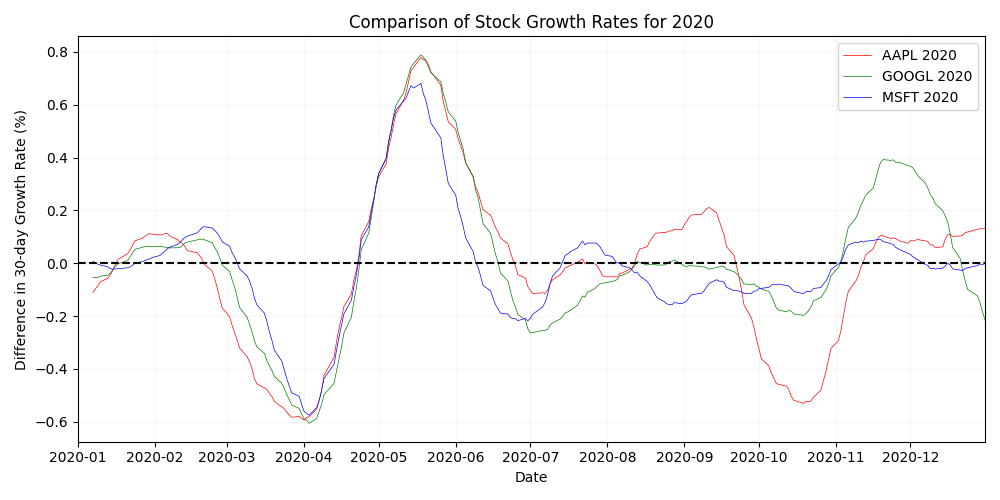
A.1 Yearly stock growth comparison (2020)
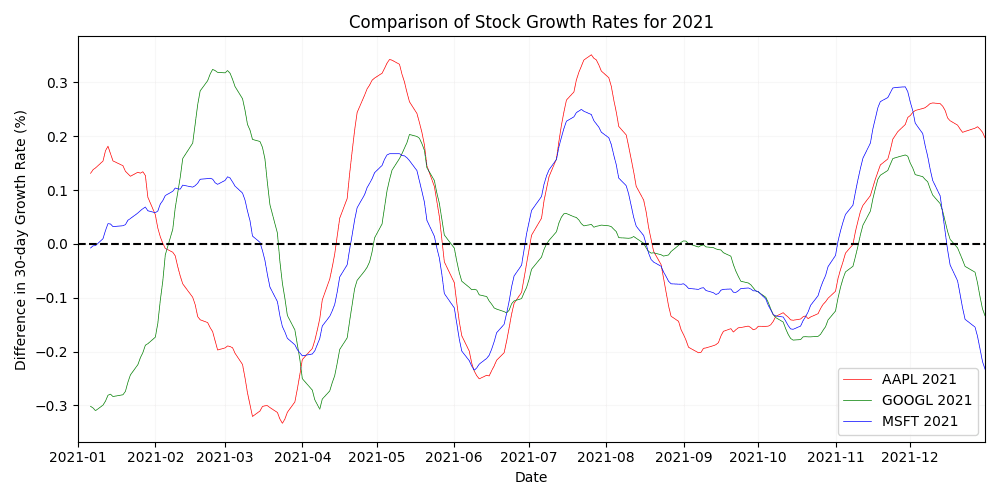
A.2 Yearly stock growth comparison (2021)
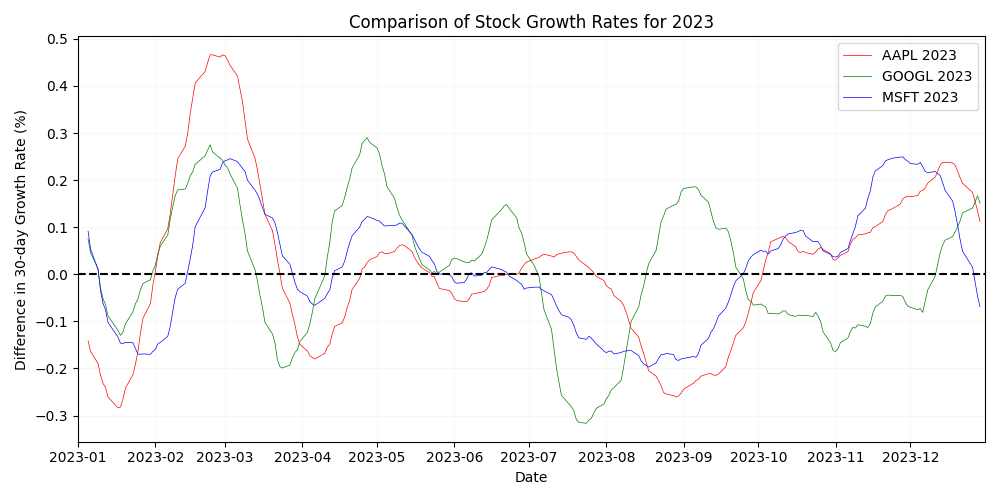
A.3 Yearly stock growth comparison (2023)
C. Table of stock-sentiment correlations
1Introduction
The effects of public opinion on financial markets has been an intriguing area of study for years. The stock market, known for its volatility and susceptibility to various factors, is a common subject for prediction model based research. Sentiment analysis, an evaluation of the tone and mood in textual data, is one of the many suitable methods for financial market forecasting.
This thesis explores a unique angle within this domain: the potential predictive power of sentiment expressed on Hacker News, a social news website particularly popular among technologists. The demographic of Hacker News, largely composed of engineers, computer scientists, and technology enthusiasts, is highly vocal about technological developments and frequently discusses the actions of major tech companies.
The central hypothesis of this research claims that there exists a significant relationship between the collective sentiment expressed through user interactions on Hacker News and the subsequent mid-term (2-3 months) market performance of relevant technology companies. By examining the potential correlation, we seek to explore whether a technically-informed community's collective opinions can serve as a meaningful market indicator.
To explore this hypothesis, this thesis adopts a mixed-methods approach, integrating sentiment analysis with financial data analysis. Topic-relevant community discourse is analyzed and compared with market performance to potentially reveal patterns and understand the relationship between Hacker News sentiment and stock behavior. In the scope of this study, this targeted approach is potentially most beneficial for analyzing stocks in the technology sector.
2Background
The intersection of public sentiment and stock market performance, also known as financial sentiment analysis (FSA) is a common subject of interest in both financial and academic circles. Thanks to the rapid developments in natural language processing (NLP), conducting accurate and contextually sound sentiment analysis is becoming more feasible. This background chapter aims to provide a comprehensive overview of the existing literature and relevant concepts that form the foundation of our research.
2.1Sentiment analysis
Sentiment analysis, also known as opinion mining, is a method within NLP that focuses on identifying and categorizing sentiments within text data. This field aims to assess emotional tones, opinions, and attitudes expressed in written or spoken language. While the primary function of sentiment analysis is to classify text into positive, negative, or neutral sentiments, modern sentiment analysis pipelines can also evaluate more nuanced emotions and context-specific sentiments. The process typically involves data collection, text preprocessing, feature extraction, model training, and evaluation. (Wankhade et al, 2022; Gupta, Ranjan, & Singh, 2024; Rahman Jim et al., 2024)
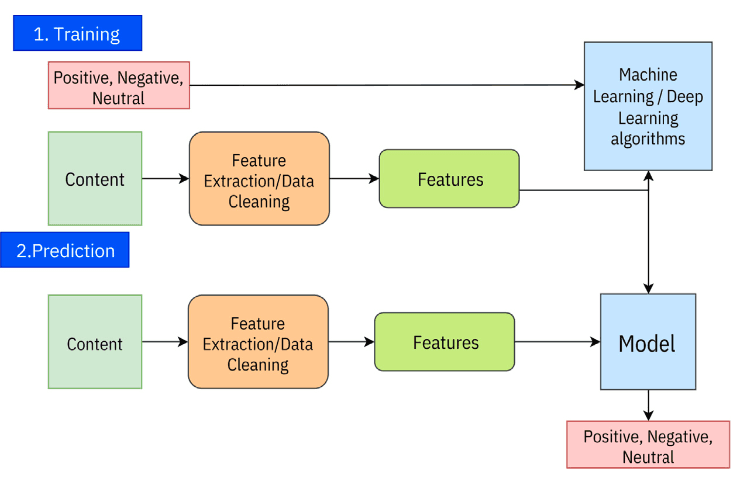 Figure 1. General working process of sentiment analysis. Reprinted from Rahman Jim et al., 2024.
2.1.1Application fields
The significance of sentiment analysis lies in its ability to provide valuable insights from public opinion. Organizations may leverage this technology for data-driven decision-making, product enhancement, or marketing strategy development (see Figure 2). By automating the analysis of extensive textual data, sentiment analysis enables businesses to understand customer sentiments, manage online reputations, and track market trends (Wankhade et al, 2022; Zhang et al, 2023). Moreover, it plays a crucial role in aiding researchers and policymakers make more informed and responsive decisions by understanding public sentiment on critical issues (Peng et al., 2018).
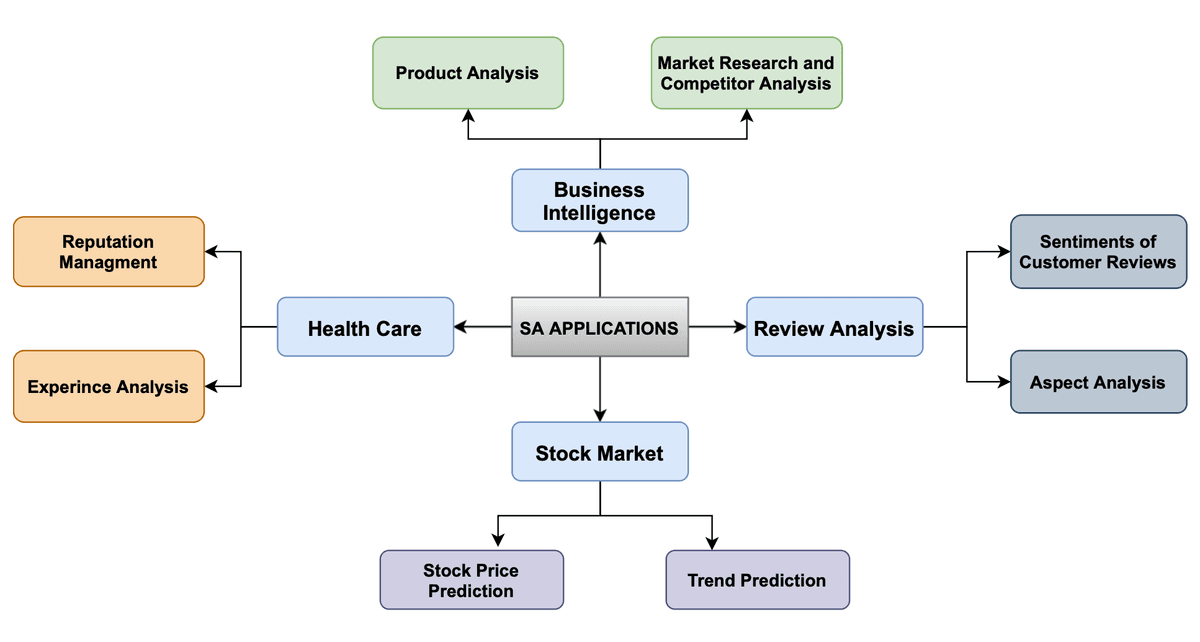 Figure 2. Applications of sentiment analysis. Reprinted from Wankhade et al., 2022
2.1.2Stock market prediction
Sentiment analysis is a powerful tool in financial forecasting, and is often referred to directly as Financial Sentiment Analysis (FSA). The foundation of this method lies in the hypothesis that public opinion, as conveyed through social media posts, news articles, and online forums, can impact investor behavior and, by extension, act as external stimuli on the stock market. (Mittal & Goel, 2012; Du et al., 2024)
Pioneering research by Bollen et al. (2011) demonstrated the predictive power of social media sentiment, using Self Organizing Fuzzy Neural Networks (SOFNN) to prove that Twitter sentiment could forecast directional changes in the Dow Jones Industrial Average with 86.7% accuracy. This widely cited study led to the rise of FSA, inspiring further research into the relationship between social media sentiment and the financial market.
Building on this work, Si et al. (2013), showed that more nuanced topic based sentiment analysis using autoregression can also yield promising results for stock price prediction. More recently, the rapid improvements in NLP are improving the accuracy of these metrics even more.
2.1.3Common methods and techniques
Sentiment analysis can be conducted using a variety of methods and techniques, each with its own strengths and unique applications. The most commonly used methods can be broadly categorized into lexicon-based approaches, machine learning techniques, and hybrid methods that combine elements of both (Wankhade et al, 2022).
Lexicon-based approaches
Lexicon-based methods use predefined lists of words, known as sentiment lexicons, where each word is annotated with a sentiment score indicating whether it is positive, negative, or neutral. The main advantage of these approaches is their simplicity and ease of interpretation. They dont require large labeled datasets for training, making them quick and straightforward to implement. (Wankhade et al, 2022; Gupta, Ranjan, & Singh, 2024; Rahman Jim et al., 2024)
However, using sentiment lexicons can have notable downsides. These methods often struggle to handle context, sarcasm, and the dynamic nature of contextual language, which can result in less accurate sentiment classification (Wankhade et al, 2022). In nuanced datasets, more advanced feature extraction techniques, such as N-grams and word embeddings (see Table 1) often yield better results.
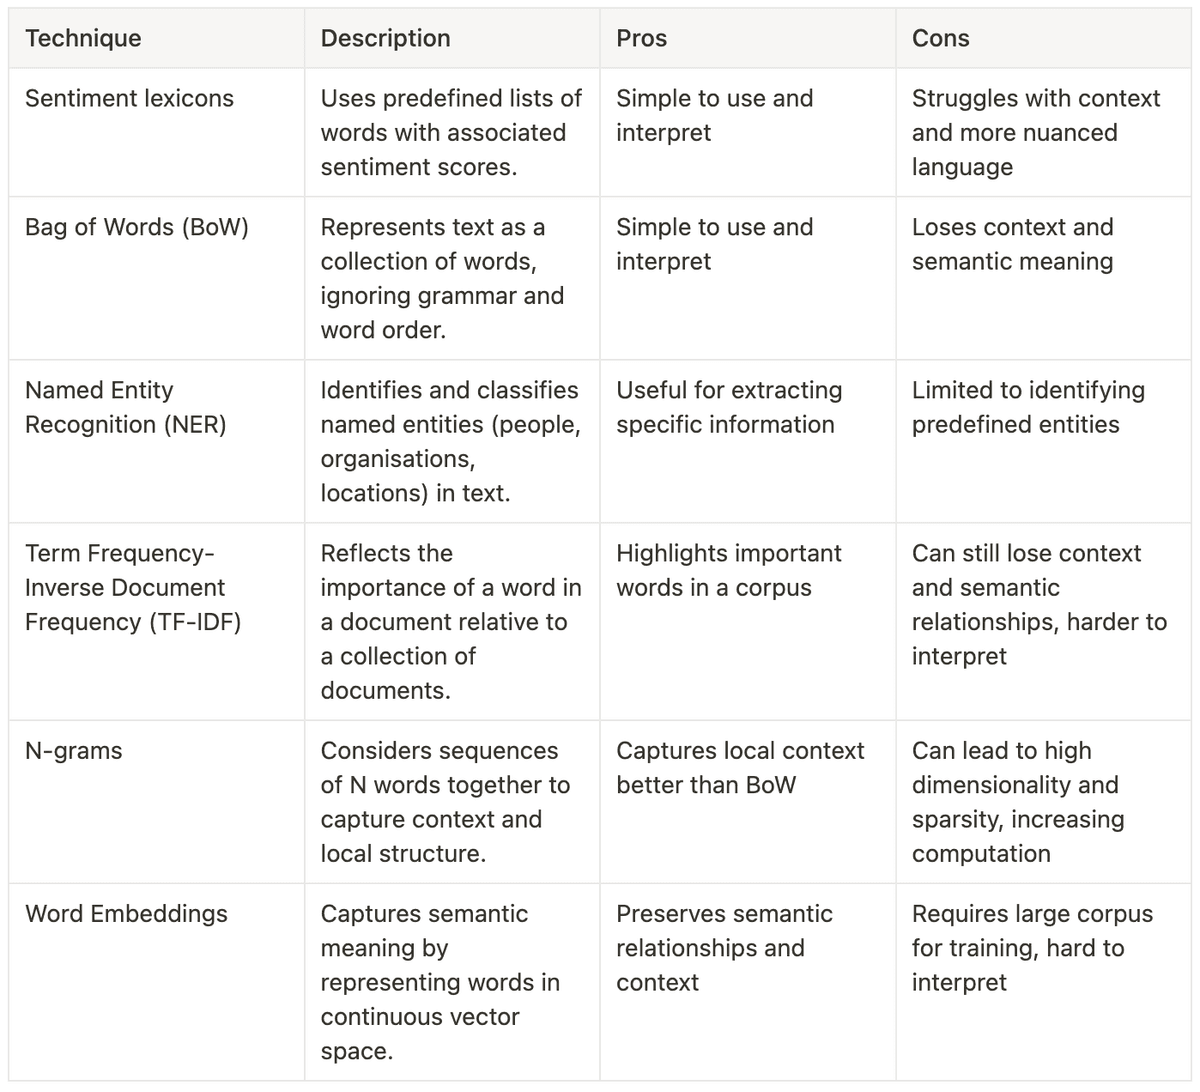 Table 1. Common feature extraction techniques in preprocessing for text analysis, ordered from relatively simplest to most complex. (Wankhade et al, 2022; Ma et al, 2018)
Machine learning
Machine learning approaches to sentiment analysis involve training models on labeled datasets to automatically classify text into sentiment categories. The primary advantage of these methods is their ability to learn from data, capturing complex patterns and understanding features that lexicon-based methods often miss. These techniques are particularly adept at understanding context and sequential dependencies in text (Rahman Jim et al., 2024).
Labeling refers to annotating data points with labels for training and evaluating models. It is a crucial step of preprocessing data for supervised machine learning, and ensuring our models are able to infer and learn. A well balanced set of labeled training data is crucial for understanding the models interpretation and understanding at different stages (Rahman Jim et al, 2024).
However, machine learning approaches also come with challenges. They require extensive preprocessing and large amounts of annotated data for training. Despite this, the power and flexibility of machine learning make it a popular choice for text-based sentiment analysis for a variety of use cases (Wankhade et al, 2022).
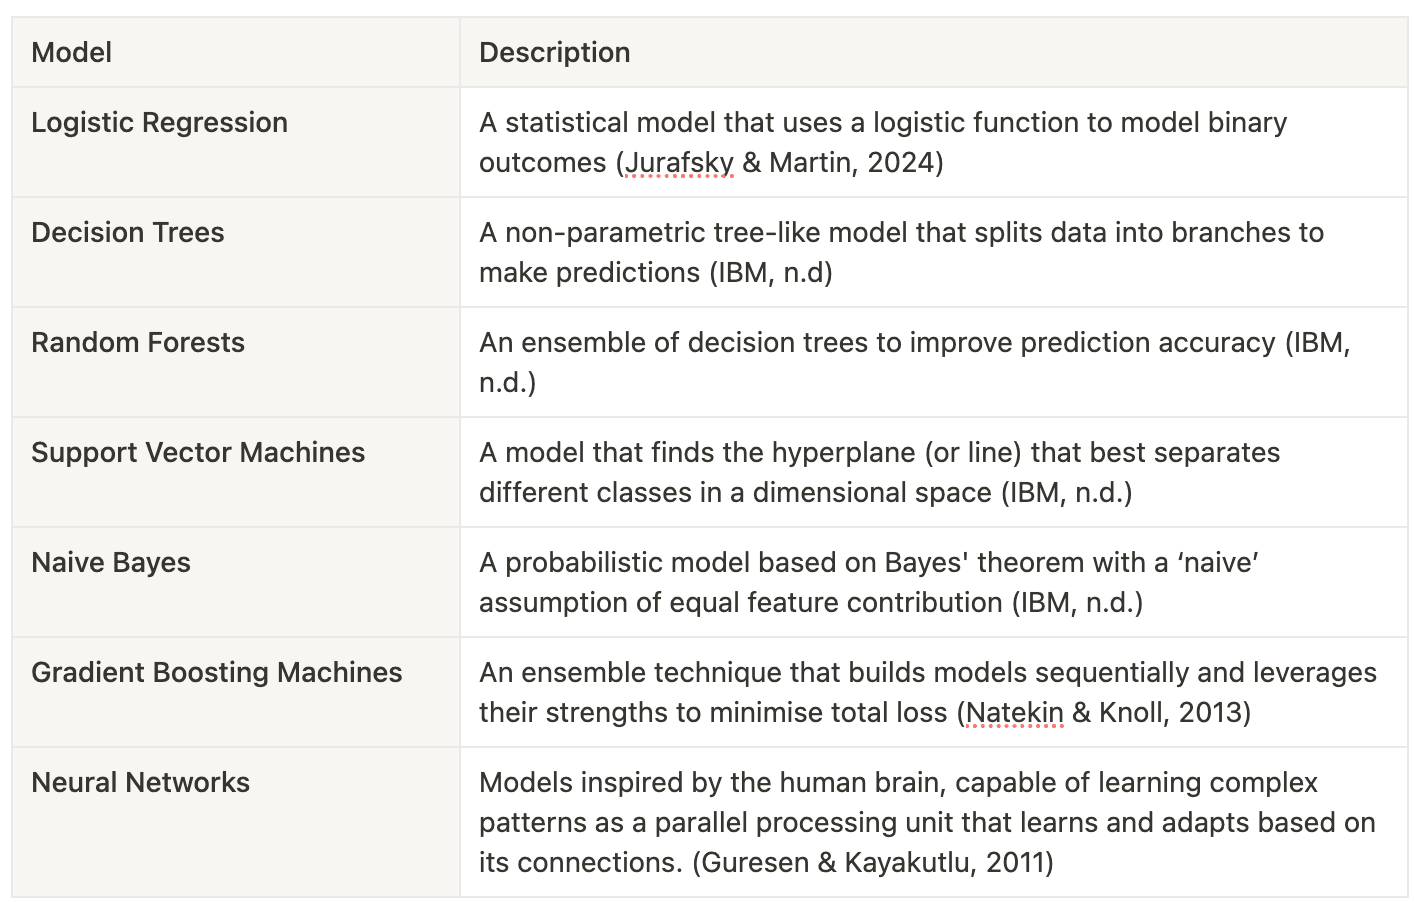 Table 2. Common machine learning models used for classification tasks
Deep Learning
Deep learning methods for sentiment analysis utilize sophisticated neural network architectures to classify text into sentiment categories. These techniques continue to advance and revolutionize the field, as deep learning architectures excel at learning and extracting complex features from raw data. Deep learning is especially effective at interpreting context, managing extensive vocabularies, and understanding sequential dependencies within text (Vaswani et al, 2023).
Deep learning models require significant computational power to train, large volumes of data, and careful parameter tuning and decision making for achieving good results. They are often referred to as 'black boxes' as a refere nce to the low transparency in their learning process and many hidden state dependencies.
Although transformers are considered to be state of the art in deep learning and natural language processing, other methods are slowly returning into academic discussion (Feng et al., 2024; Wankhade et al, 2022). Most common criticism regarding transformers, although they are seen as most performant, is their exponential computation needs.
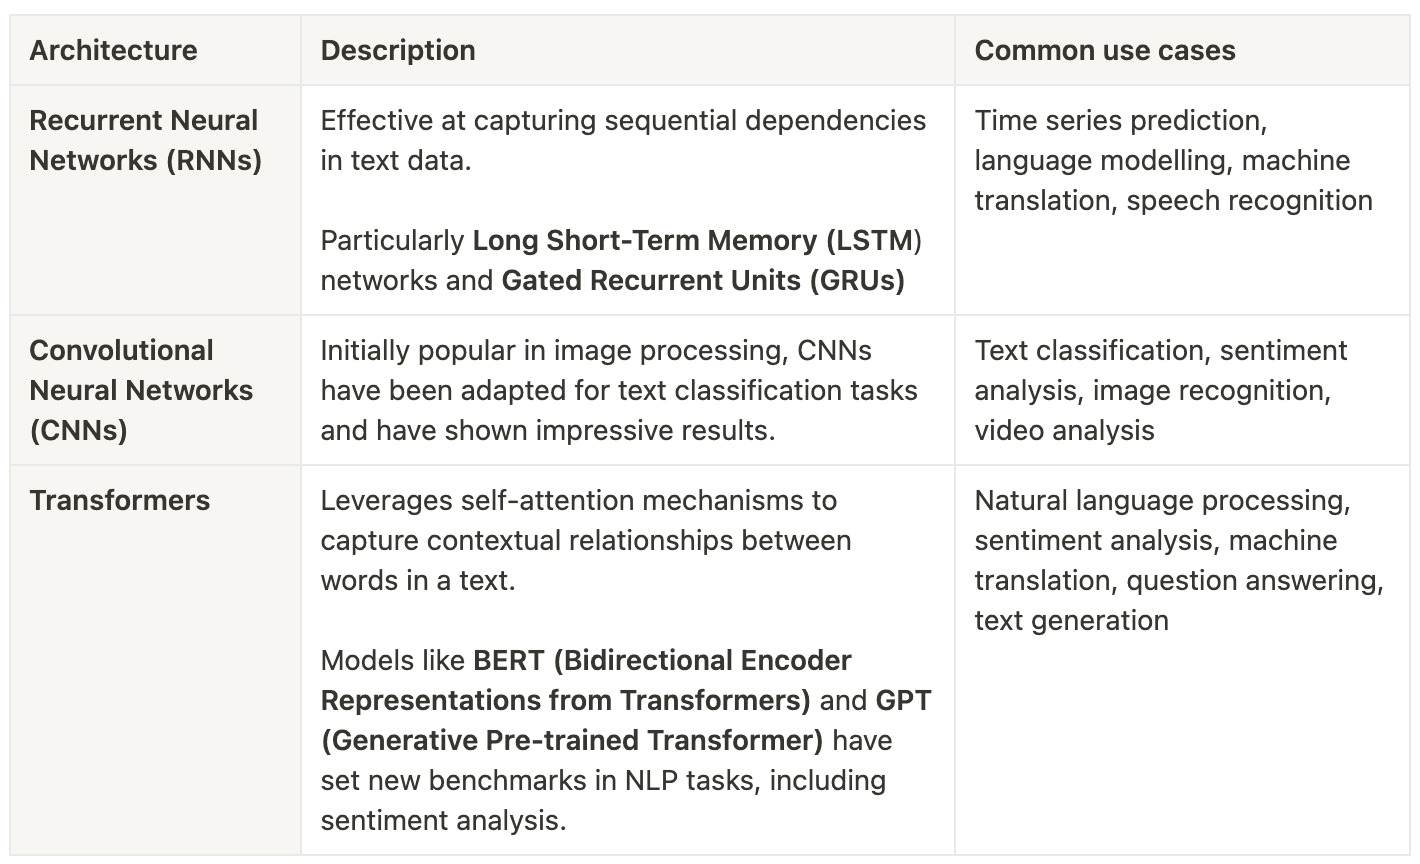 Table 3. Common deep learning models used in text processing (Vaswani et al., 2023; Feng et al., 2024, Ma et al, 2018)
2.1.4Recent advances
Recent advancements in sentiment analysis have been primarily driven by machine learning (ML) and deep learning (DL) techniques (Rahman Jim et al, 2024). Breakthroughs in NLP, specifically regarding the fast improvement of transformers, is helping tackle nuance and contextual relevance in texts, which are considered some of the hardest problems in sentiment analysis (Deng et al, 2023; Zhang et al, 2023).
T hese approaches, encompassing traditional ML algorithms and sophisticated neural networks, have significantly improved the accuracy and scalability of sentiment analysis systems. The field continues to rapidly evolve, with ongoing research focusing on developing more advanced models and techniques to enhance sentiment classification capabilities (Rahman Jim et al, 2024; Zhang et al., 2023).
2.2Challenges of sentiment analysis
Sentiment analysis of informal communication presents numerous challenges, with one of the most critical issues being the accurate detection of sarcasm and irony (Wankhade et al., 2022). By potentially conveying a meaning opposite to their literal interpretation, automated systems may fail to correctly assess sentiment. interpretation, automated systems may fail to correctly assess sentiment.
2.2.1Cognitive bias
Another significant challenge in the sentiment analysis of online communities is the potential for introduced bias, often manifested as 'groupthink' or 'echo chambers'. These phenomena occur when individuals with similar views interact primarily within their group, reinforcing existing beliefs and potentially moving towards more extreme positions (Cinelli et al., 2021).
The formation of these chambers is not solely due to platform algorithms but also stems from inherent human cognitive biases (Morales et al., 2021). In the context of this study, we can assume the opinions of early commenters to have a strong impact on the opinions and narrative associated with that article (Stoddard, 2021).
As the commentary on Hacker News is primarily conversational (commenters often reply to others, forming long threads of discourse) these 'anchor comments' may have significant effects on the overall sentiment of specific articles.
2.2.2Specialized language
Sentiment analysis on technical domains, such as is expected to be present on Hacker News, presents unique challenges due to the specialized nature of the text corpus. The complexity of sentiment analysis increases with the frequent use of programming language syntax, code snippets, and technical abbreviations, which are significantly less represented in commonly used sentiment lexicons (Rahman Jim et al, 2024).
This poses significant difficulties for traditional natural language processing techniques, and requires thorough knowledge of the text corpus and domain adaptation in order to accurately work (Wankhade et al. 2022; Fang et al., 2022).
2.2.3Contextual knowledge
In sentiment analysis, the absence of contextual knowledge can present a significant challenge. Context is particularly crucial when analyzing platforms like Hacker News, where the conversational nature of commentary can obscure the true meaning of opinions. When responses are taken out of context, models may misinterpret them, leading to unpredictable outcomes (Rahman Jim et al., 2024).
While this remains an open area of exploration in NLP, there are various NLP techniques that aim to address these challenges. For example, Long Short-Term Memory (LSTM) networks are effective in handling sequential data. They consider word order and context, selectively retaining relevant information and discarding irrelevant details, which reduces ambiguity and has enhanced the accuracy of sentiment analysis (Nowak et al., 2017; Ma et al., 2018).
More recently, models based on the Transformers architecture like BERT (Bidirectional Encoder Representations from Transformers) have advanced the field significantly by processing entire sentences simultaneously (Gupta, Ranjan, & Singh, 2024). BERT models are capable of understanding context and nuances by leveraging its attention mechanism, making it effective for complex sentiment analysis tasks (Vaswani et al., 2023; Devlin, 2018).
2.3The potential of niche forums
The potential of niche forums in enhancing predictive models was highlighted by Deb et al. (2018), who found that sentiment analysis from specialized online communities outperformed more general predictive signals. This has been proven true by correlating sentiment from hacker forums with the probability of cyber attacks (Deb et al., 2018; B. Mardassa, 2024). These findings underscore the potential value of platforms like Hacker News as a data source for tech stock prediction.
2.3.1Hacker News: A Unique Data Source
Hacker News, founded by Y Combinator in 2007, has grown into a significant platform for technology-related discussions. Its user base, primarily composed of tech professionals and enthusiasts, offers a distinct perspective on industry trends and company performances.
Pieter Levels, a known tech entrepreneur, claims in his book "Make" (2018) that Hacker News is often the first place where the downfall or rise of tech businesses is accurately predicted. Although commonly cited in tech discourse, Pieter lacks concrete evidence for this claim. This has largely inspired and helped form the hypothesis of this study.
In comparison to other social news platforms, Hacker News exhibits a strong correlation between the perceived quality of articles and their reach, unlike the personalized, interest-based approach prevalent in most social platforms (Stoddard, 2021). As a result of having no personalized content algorithms, the curation approach of Hacker News helps mitigate polarization - the division of users into distinct groups with limited exposure to differing viewpoints (Arora et al., 2022).
However, it is important to note that early feedback significantly impacts the ranking algorithm of Hacker News (Stoddard, 2021; Salihefendic, 2015 ). While the overall ranking and popularity of Hacker News articles are not a primary focus of this research, the psychological effects of peer opinion and the formation of echo chambers may be relevant. These challenges will be considered in this paper.
3Study methodology
Our hypothesis is that Hacker News sentiment may precede more widely recognized signals in measuring tech company performance. However, claiming direct influence of Hacker News sentiment on financial markets would oversimplify the complex factors driving stock prices, which extend beyond the discourse on any single platform.
A comparative study is proposed to examine the relationship between sentiment on Hacker News and changes in the corresponding company's stock performance. To test the central hypothesis raised in this thesis, we focus on high market cap technology companies and their direct mentions on Hacker News.
An analysis of the market movements of prominent technology companies is conducted to identify periods of increased volatility relative to the broader technology market. All direct company mentions are extracted and preprocessed. This preprocessing includes text normalization and the application of a custom classifier model, specifically Support Vector Machines (SVM), to clean the individual company datasets.
Comments deemed relevant by the classifier are then subjected to sentiment analysis using a BERT model (BERTweet) fine-tuned on short-form text content. The sentiment analysis results are subsequently compared with the stock's performance, both in real time and introducing a delay of 1-2 weeks to account for the predictive factor hypothesized in this study.
By analyzing the sentiment data and its correlation with the stock price, the aim is to determine whether Hacker News sentiment can serve as a predictive indicator of significant changes in a technological company's stock performance.
3.1Model evaluation metrics
Four evaluation parameters are frequently discussed in this study when assessing model performance. Mean 5-fold cross-validation accuracy, precision, recall, and F1-score were chosen as they represent and help evaluate different aspects of a machine learning model. Other evaluation methods may be introduced and explained where applicable.
- Mean 5-fold cross-validation accuracy
Mean 5-fold cross-validation accuracy provides an average accuracy score obtained from performing 5-fold cross-validation on the dataset. It helps in understanding how well the model generalizes to an independent dataset, and helps identify overfitting. It is often presented together with variance to indicate the stability and consistency of the model's performance across different folds.
- Precision
Precision measures the proportion of true positive predictions among all positive predictions. It is an indicator of the model’s ability to not label a negative sample as positive. It is calculated as follows:
- Recall
Recall, or sensitivity, measures the proportion of true positive predictions among all actual positive samples. It indicates how well the model can identify positive samples. It is calculated as follows:
- F1 score
The F1 score is the harmonic mean of precision and recall, providing a balance between the two metrics. It is especially useful when the class distribution is imbalanced. It is calculated as follows:
3.2Correlation metrics
Correlation coefficients are used to quantify the relationship between sentiment on Hacker News and the stock's performance. They are utilized to understand the strength and direction of the association between two variables. The three coefficients used are Pearson, Kendall, and Spearman, which all range from -1 to 1, with 1 indicating a perfect positive linear relationship, and -1 a perfect negative linear relationship.
- Pearson Correlation Coefficient
The Pearson correlation coefficient measures the linear relationship between two continuous variables. Pearson's coefficient is sensitive to outliers and expects that the data is normally distributed and linearly related. (DATAtab, 2024)
- Kendall's Tau
Kendall's Tau is a non-parametric measure of correlation that assesses the ordinal association between two variables. Unlike Pearson, Kendall's Tau does not assume a linear relationship or normal distribution, making it more robust to outliers. It works well when the data is not normally distributed or when dealing with ordinal data. (Datatab, 2024)
- Spearman's Rank Correlation Coefficient
Spearman's Rank Correlation is another non-parametric measure that evaluates the relationship between two variables. As defined by Datatab, Spearman's Rank is “the non-parametric counterpart of Pearson's correlation”. It transforms the data into ranks before calculating the correlation, hence making it less sensitive to outliers and useful for both continuous and ordinal data. (Datatab, 2024) data into ranks before calculating the correlation, hence making it less sensitive to outliers and useful for both continuous and ordinal data. (Datatab, 2024)
4Companies in focus
To establish which companies to focus on I looked at the S&P 500 , which is often referred to as the ETF fund with the leading S&P Dow Jones Indices, n.d.
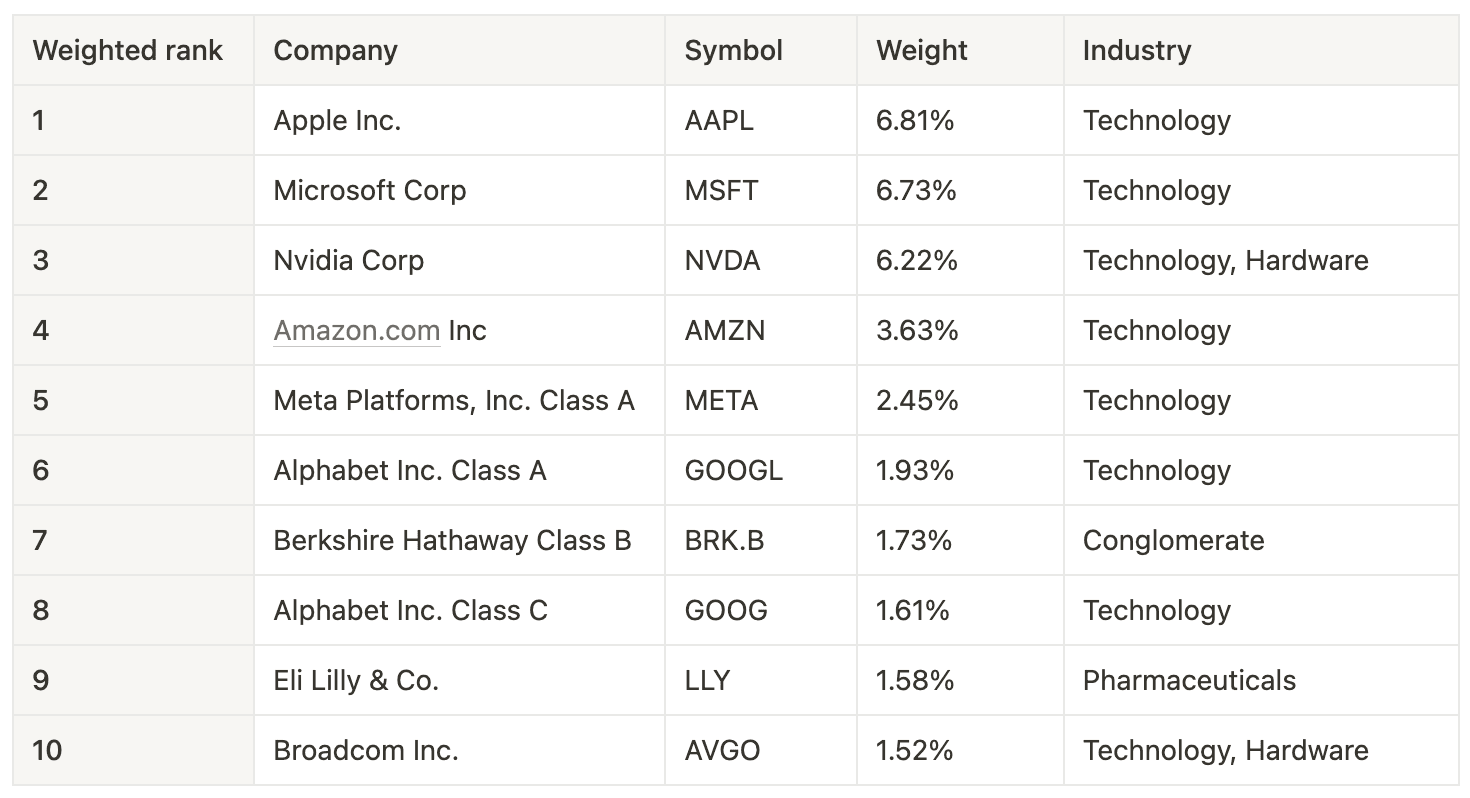 Table 4. Fluctuating estimation of the market capitalisation-weighted index of leading S&P 500 companies. Retrieved from Nasdaq on September 16, 2024
 As a next step, direct mentions of common titles of the high-ranking tech companies were retrieved from Hacker News using the Algolia API, looking at all comments posted in the last year (see Table 5). These numbers followed the ranking system with few exceptions – despite its lesser market cap, Google was most mentioned with 918,000 direct references, and Nvidia, despite its recent rise to the third highest valued company, was mentioned less than expected (10,000 mentions).
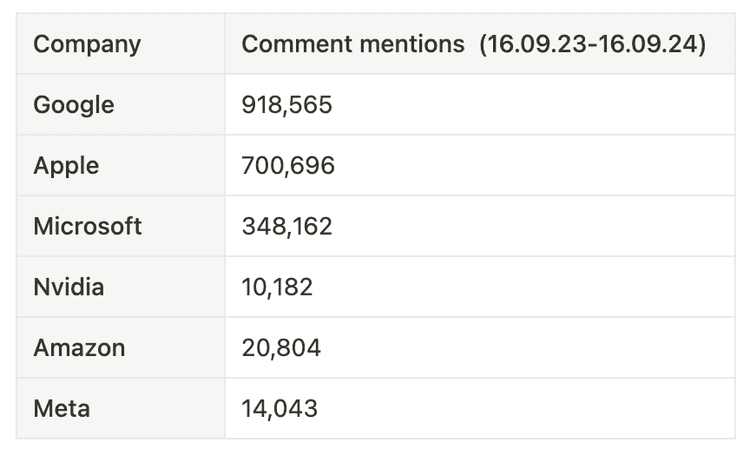 Table 5. Company mentions in Hacker News comments in the previous year. Retrieved from Algolia on September 19, 2024
Based on this, Google, Apple and Microsoft were chosen as the main subjects of study. The stock was visually evaluated based on past data to identify periods of significant changes in stock valuation. There is a clear overall trend in the sector which all chosen stocks seem to follow, and significant growth can be noted during this period. However, it is still possible to determine outlier periods when the stocks were individually impacted - or leading the market into a period of change.
4.1Determining periods of volatility
As a means to try and differentiate individual stock movements from trends in the general market sentiment and the sector, two experiments were conducted. The hypothesis was that by narrowing down this study to look at periods where the stocks under study moved in an unexpected direction not shared by the rest of the market, we will be able to make stronger claims to the underlying factors that triggered this change.
A comparative analysis of stock price volatility was conducted for the selected technology company stock (AAPL, GOOGL, and MSFT) over a five-year period from 2019 to 2024. The stock data was retrieved from Nasdaq.
In the figures below, the main lines represent the 30-day Simple Moving Average (SMA) of each stock's normalized price. The normalized price is calculated as the percentage change from the initial price at the start of the period. This allowed for simpler visual comparison of relative performance across stocks with different absolute evaluations.
An experiment was conducted to reveal periods of high volatility for individual stocks. In the following figures, a stock is considered to have high individual volatility when two conditions are met:
- The stock's volatility (measured as the 10-day rolling standard deviation of daily returns) exceeds a threshold percentile.
- Simultaneously, the volatility of all other stocks in the comparison remains below a specified lower percentile.
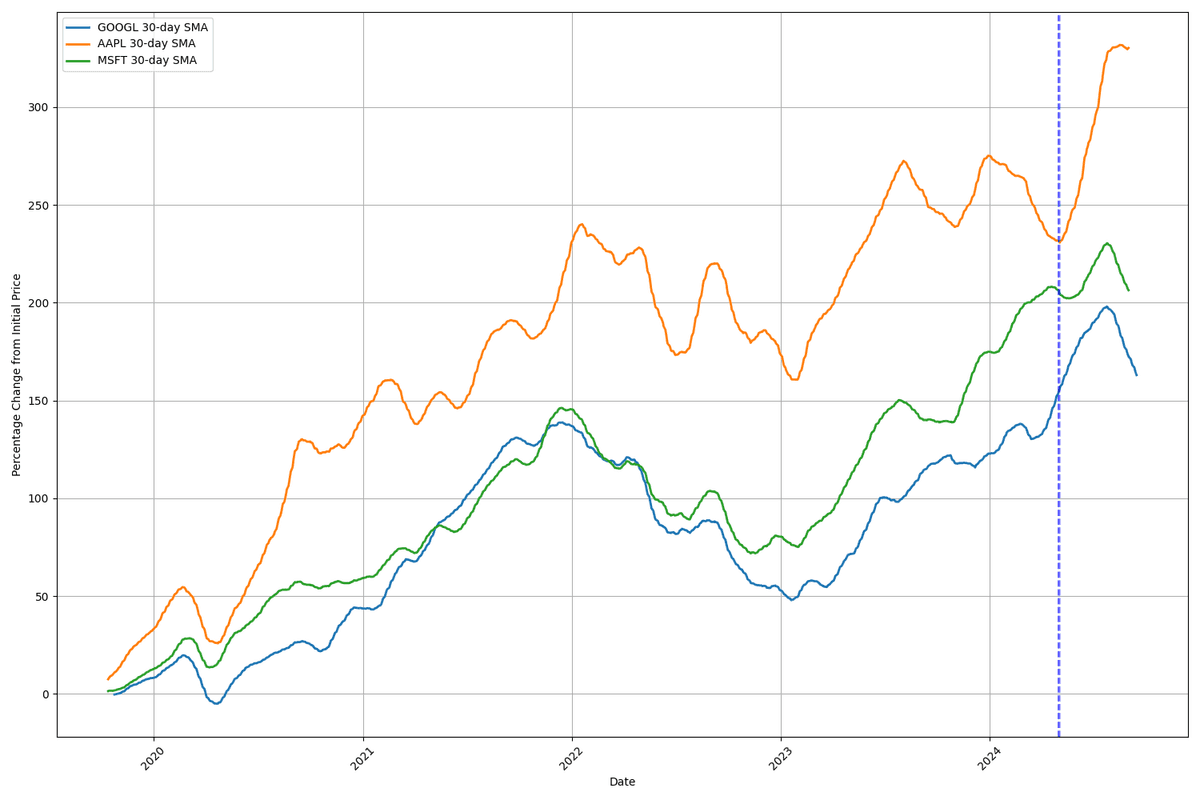 Figure 3. Comparative analysis of normalized stock prices and volatility for selected tech companies between 2019-2024. Using high contrast volatility indicators (95th/75th percentile respectively)
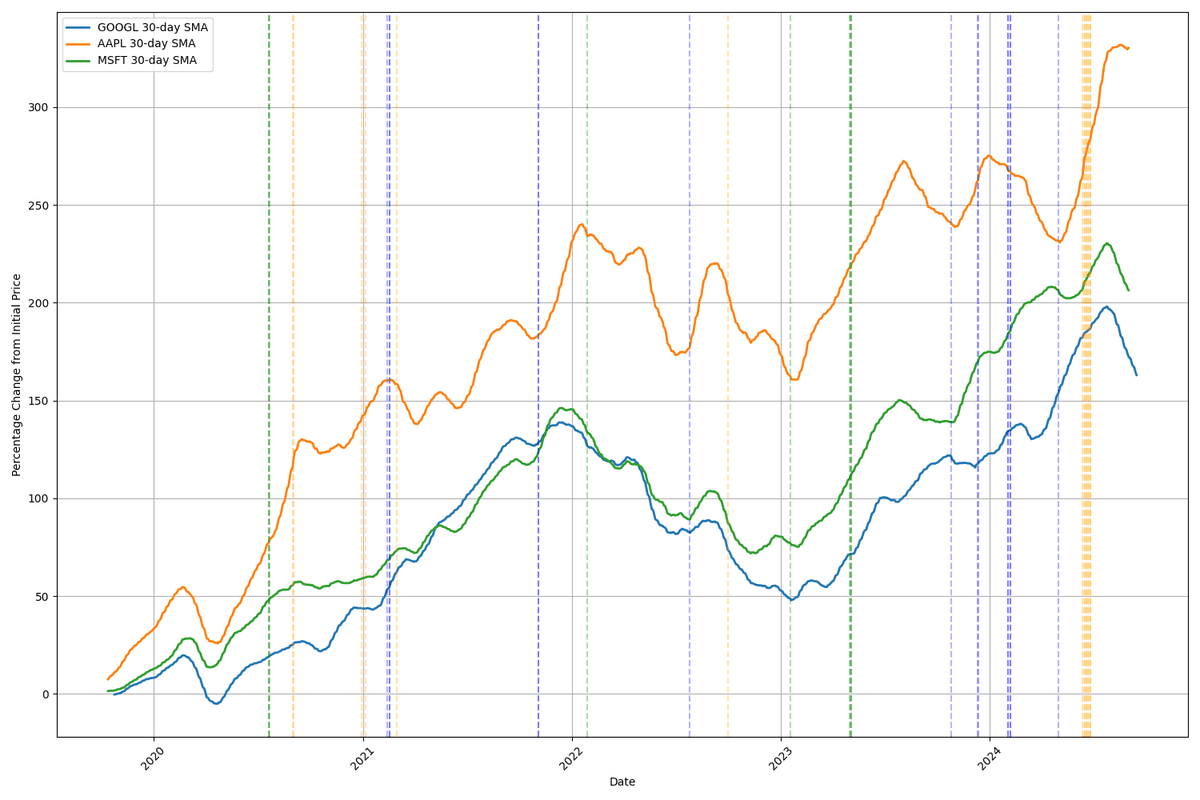 Figure 4. Comparative analysis of normalized stock prices and volatility for selected tech companies between 2019-2024. Using high contrast volatility indicators (75th/50th percentile respectively)
Figures 3 and 4 help reveal the more subtle and individual periods of stock volatility for the chosen companies. Figure 3 confirms that the market tends to move in a similar overall trend with strong relative overlap when comparing the smoothed averages.
Figure 4 is more sensitive to volatility, and identifies time periods where the market reactions have triggered smaller changes in price. Notable periods are often clustered, such as rapid and continuous growth for AAPL in mid-2024, and the volatile rates of GOOGL in late 2023 and early 2024.
To have clearer visuals and another perspective, the chosen stocks were also plotted based on their percentage change over a 30-day average. A visual comparison of growth rates in 2022 (see Figure 5), supports the findings of Figure 4, which detected low indicators for substantial individual movement for that year.
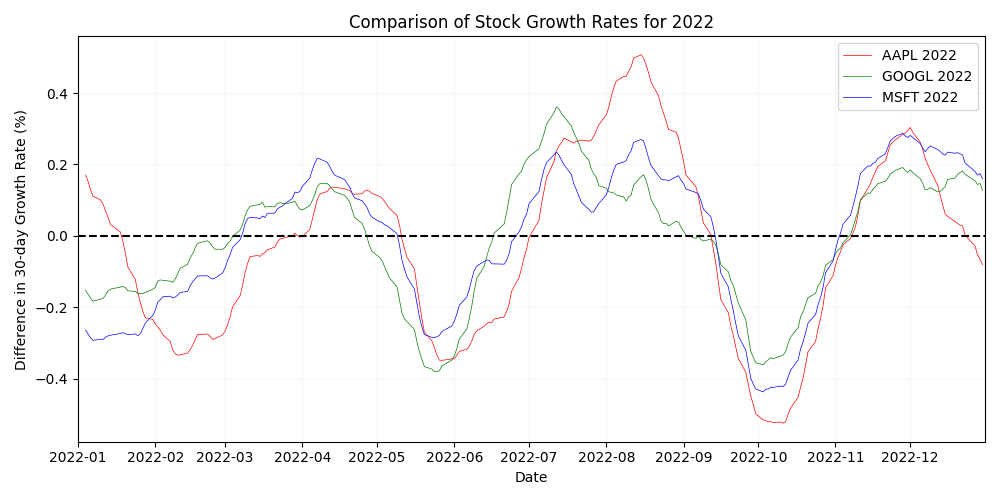 Figure 5. Comparison of stock growth rate percentages for Apple, Google and Microsoft in 2022.
 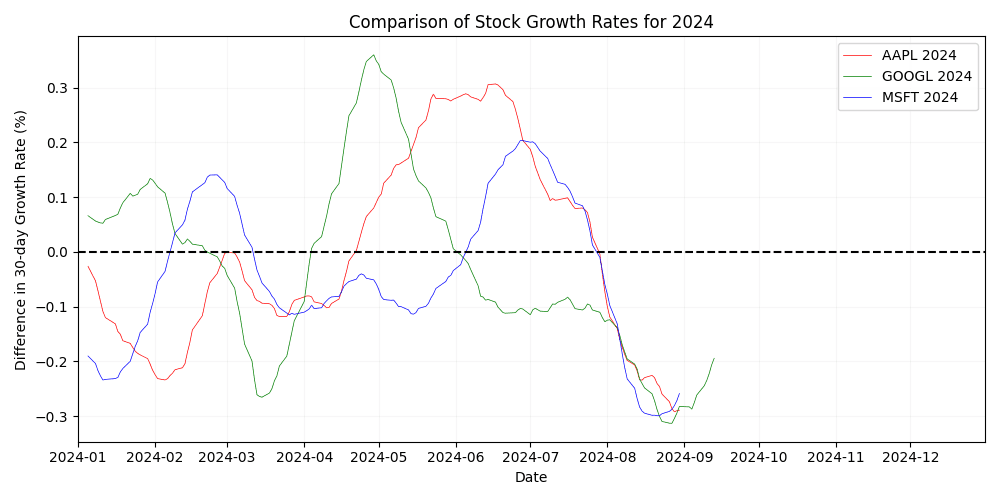 Figure 6. Comparison of stock growth rate percentages for Apple, Google and Microsoft in 2024.
 In comparison to results from 2022, more individual movement can be noted for 2024 (see Figure 6). A substantial and sharp rise in Google valuation (the most volatile event in the last 5 years, according to Figure 3) can be noted, as well as a period of maintained growth for Apple in Q2, while other valuations decreased. To see the figures for all years under study, see Appendix A.
Time periods for this study were chosen based on the relative comparison of normalized stock movement between late 2019 to present, based on the results of the comparative representations of stock trends introduced above. As a result, the following companies and time periods will be a subject of this study:
- Apple – August 2023 to June 2024 (11 months)
- Google – January 2023 to October 2023 (10 months)
- Microsoft – November 2019 to August 2020 (11 months)
4.2Assembling the datasets
For each company in focus, a dataset of comments was programmatically formed through text matching for common names and popular products associated. To avoid the ambiguity and problems that arise with mismatched context, only direct mentions of companies were included.
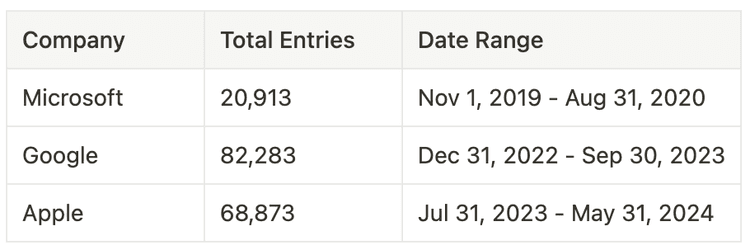 Table 5. Summary of collected comment data and ranges of study.
 The comment s were collected using the Algolia Hacker News API, which allows advanced relevance sorting compared to the Y Combinator API.
4.2.1Preprocessing
The data underwent preprocessing through tokenizing sentences to extract only the context relevant mentions. All comments were converted to lowercase, common contractions were expanded, and uncommon punctuation was removed to standardize the input format and mitigate potential distractions for the machine learning models. Lemmatization and stopword removal were attempted, but discarded due to their detrimental effects on model performance.
4.2.2Dataset evaluation
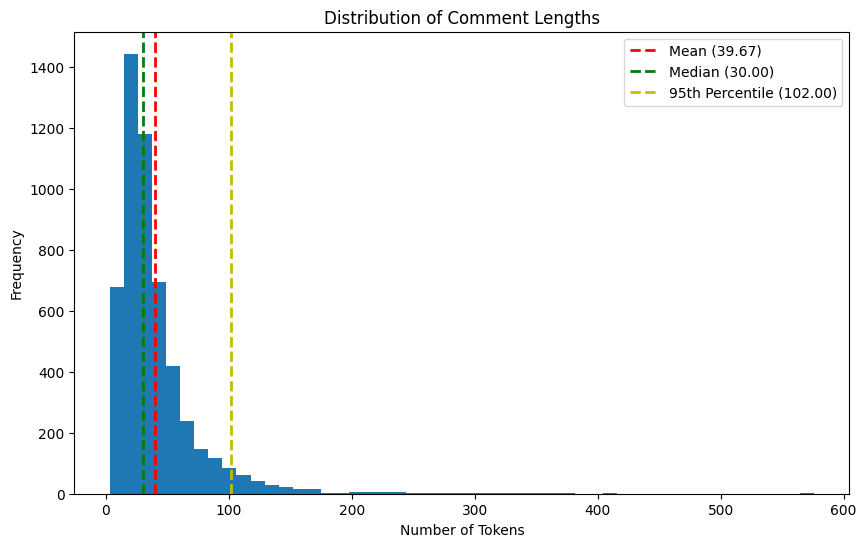 Figure 7. Distribution of tokenized comment lengths mentioning Google after preprocessing.
 Prior to conducting sentiment analysis, a critical step in noise reduction was to assess the relevance of comments within the dataset. Merely mentioning the company did not necessarily mean it was the intended sentiment target. Furthermore, many comments, although direct references to the companies in focus, were extracted from longer conversational threads, making the associated sentiment ambiguous and difficult to infer.
Additionally, the challenge of separating mentions of polysemous terms, such as distinguishing 'apple' as the fruit and 'Apple' the company, had not yet been addressed. As a general estimate, approximately 30% of the dataset consisted of noise – data that could skew or obfuscate the analysis results in subsequent steps due to ambiguous references.
5Classification model
To improve the relevance of the collected data, a binary classifier was implemented to refine the datasets. Depending on the size of the dataset per specific company, 5-30% of the dataset was selected for labeling, to retrieve a minimum of 5,000 samples per company. This sample size was found to be minimal to achieve low variance in cross-fold validation and hence avoid overfitting.
5.1Labeling samples
Leveraging Large Language Models (LLMs) for reasoning tasks like data labeling has neared human performance for simpler tasks, even in a zero-shot context (Deng et al., 2023; Brown et al., 2020). They were chosen here for labeling as a reasonable alternative to human annotation.
The labeling process used two state-of-the-art LLMS known for their good reasoning capabilities “gpt-4o” (4o) and “gpt-4o-mini” (4o-mini) to help determine the relevance of comments in the sample set. The template was put together based on the insights from other recent similar studies using LLMs for labeling (Deng et al., 2023; Zhang et al., 2023). This meant defining a simple prompt, and using the 4o model to add more specific instructions to reduce the potential bias of a human written prompt.
Sample text was formatted to be included in the prompt using Python f-strings, and processed using OpenAIs batch processing functionality, a recent feature from OpenAI meant to facilitate similar tasks (OpenAI, n.d.). See Appendix B for a table representation of used prompts.
5.1.1Confidence scoring and sample selection
To enhance reliability and assign confidence scores, each sample was subjected to multiple evaluations. Each sample was labeled twice per model, resulting in a total of four labels per sample. This allowed for a more comprehensive assessment of inter-model agreement and label consistency.
The multiple labelings per sample facilitated the calculation of confidence scores, which were crucial in determining the final dataset composition. Higher weights were assigned to the votes of 4o as the more advanced model.
Samples with an average confidence score exceeding 0.8 were designated as positive (relevant) samples. Samples with an average confidence score below 0.6 were classified as negative (irrelevant) samples. A high threshold for positive samples was implemented to ensure that only the most unambiguously relevant samples were included as relevant.
5.2Evaluation of feature representation methods
To determine relevance without relying on large language models (LLMs), various machine learning models were trained for classification using two different text vectorization techniques. Initially, the Term Frequency-Inverse Document Frequency (TF-IDF) method was employed to quantify the importance of words within the document corpus. This approach was compared with DistilBERT vectorization. DistilBERT is a common resource-efficient alternative for advanced language processing ( Distilbert/distilbert-Base-Uncased · Hugging Face , 2024). BERT models are known for their ability to capture nuanced features in text, and the distilled version introduced by Sanh (2018) has achieved largely comparable results to the base model in downstream tasks.
For this experiment, a dataset comprising 15,375 comments mentioning Apple was collected over 61 days from February to April 2024. A Support Vector Machine (SVM) architecture was chosen for training due to its flexibility and good generalization in text classification. Both the TF-IDF and DistilBERT models were trained on this identical dataset to ensure a fair comparison.
5.2.1Model comparison
The mean cross-validation (CV) accuracy for the models demonstrated that DistilBERT outperformed TF-IDF, achieving a mean accuracy of 75.68% with a smaller variance of ±0.0082. In contrast, the TF-IDF model achieved a mean accuracy of 70.11% with a higher variance of ±0.0451 (see Table 6). This suggests that DistilBERT's more nuanced semantic representation of text improved model performance.
 Table 6. Table of results training a SVM-based classification model with two different feature representations
The TF-IDF model labeled a larger number of samples positively, including 10,112 entries (65.76% of the dataset) compared to DistilBERT's 6,156 entries (40.04%). As the feature representation method on which the model learns to reason, TF-IDF likely produced more uncertain results due to its broader and more simplistic approach to scoring word importance. DistilBERT's more selective inclusion could be attributed to its ability to capture deeper semantic nuance, and therefore enable the model to learn more from the labeled training data.
5.2.2Effect on Sentiment Analysis
To evaluate their effect on the pipeline as a whole, the sampled results were used to train two otherwise identical sentiment analysis models. As seen in Figure 8, the sentiment of comments from the distilBERT model was less likely to be labeled as neutral. The average sentiment scores for TF-IDF and DistilBERT were -0.19 and -0.23 respectively, while mean scoring confidence remained equal at 0.77. The scoring confidence was used to weigh results in future stages.
Despite this, TF-IDF and DistilBERT both indicated a predominantly neutral sentiment, with the TF-IDF model labeling 44.94% of entries as neutral and DistilBERT 39.55%. However, DistilBERT was able to identify a higher proportion of negative sentiments (43.66%) compared to TF-IDF (39.05%), while both models had a similar percentage of positive sentiments, with DistilBERT slightly higher at 16.78% compared to TF-IDF's 16.01% (see Figure 8).
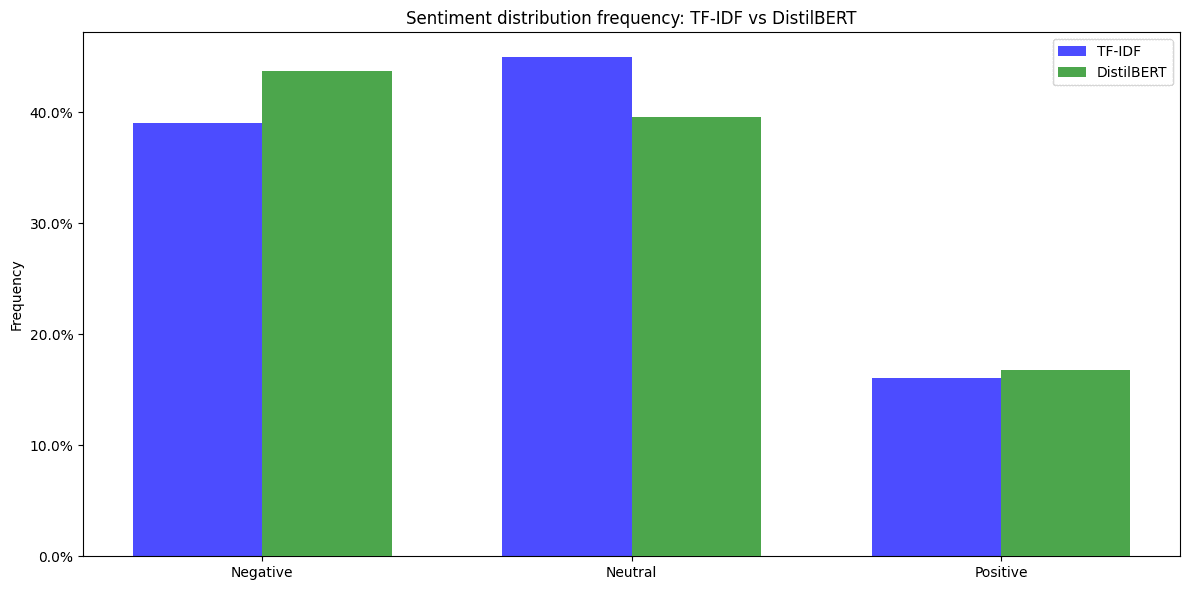
Figure 8. Sentiment distribution frequency with two different feature representations used.
5.2.3Choice of feature representation
The TF-IDF model was retained for further analysis. Figure 9 illustrates how although TF-IDF "dampened" the results by filtering out more neutral comments, it still captured the overall sentiment trends well. Despite TF-IDF's broader inclusivity, which introduced a higher convergence towards 0, it effectively maintained a consistent alignment with the sentiment shifts identified by the more accurate DistilBERT-based model.
On visual comparison of the dataset classification both models were effective in filtering out most crucially irrelevant comments – for example, references to 'apple' as a fruit in comparison to references to 'Apple' the company. This indicates that TF-IDF could still efficiently filter out noise while remaining more computationally efficient in further stages of model evaluation and iteration.
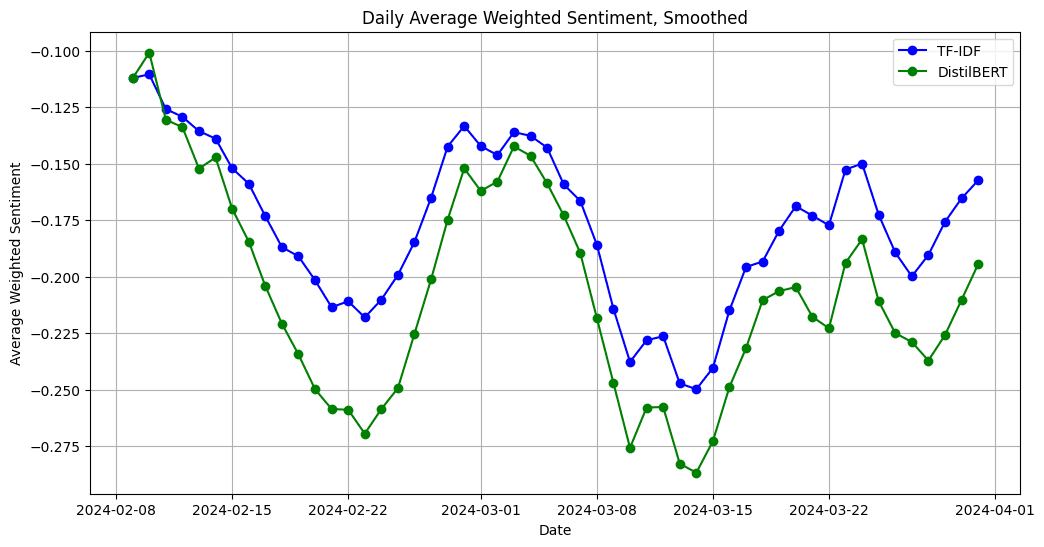 Figure 9. Daily average weighted sentiment, comparison of models using TF-IDF and DistilBERT for feature representation.
 5.3Comparison of model performance
Consecutively, another experiment was conducted to compare performance on a smaller, balanced dataset and a larger, imbalanced dataset (see Tables 7 and 8). This was done to compare model performance and the effects of bias with imbalanced class representation.
Several classification algorithms were tested, including Logistic Regression, Naive Bayes, Gradient Boost, Random Forest, and Support Vector Machines (SVM). Interestingly, all models demonstrated similar performance metrics, with accuracy scores clustering around 70% and exhibiting minimal variance. This consistency across different algorithms highlights a potential bottleneck, which could likely be attributed to the limitations of TF-IDF as the chosen feature representation method.
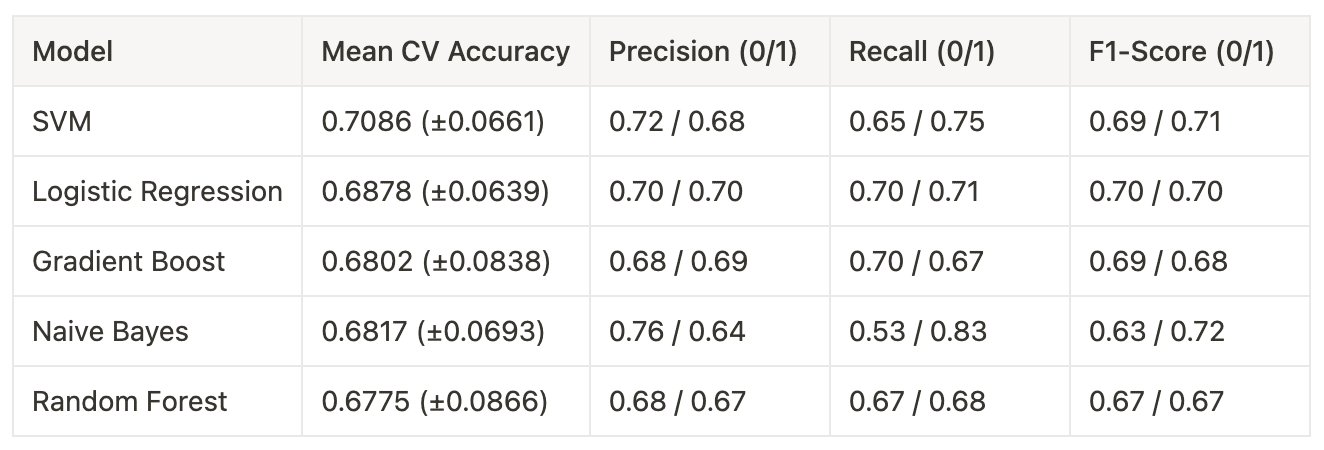 Table 7. Performance comparison of machine learning models for binary classification of comment relevancy in sentiment analysis. Trained for Google with 5,234 equally represented samples
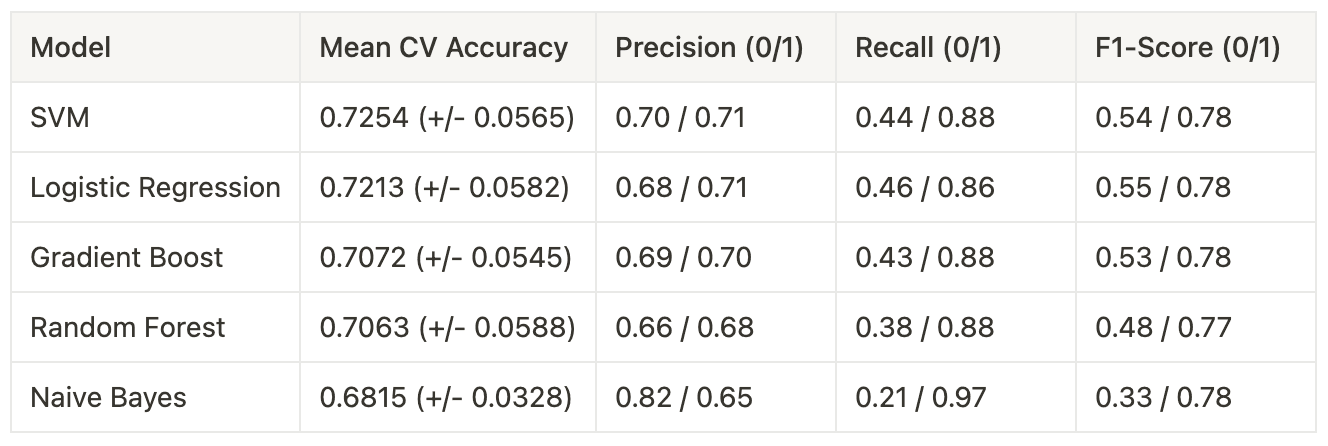 Table 8. Performance comparison of machine learning models for binary classification of comment relevancy in sentiment analysis. Trained for Google with 6,668 unequally represented samples (60/40 split)
The results across different model architectures showed acceptable results for the classification task. This implied that the complexity of the problem could be captured by these models to some extent.
Inspecting the classified dataset of the top performing models - SVM and Logistic Regression - confirmed that most clearly irrelevant comments were effectively filtered out by both models. These two models were chosen for further evaluation.
5.3.1Evaluation results
The overall accuracy of the models slightly improved in the imbalanced dataset scenario (from 70.86% to 72.54% for SVM, and from 68.78% to 72.13% for Logistic Regression). However, this increase in overall accuracy is highly probable to be influenced by the model's performance on the majority class rather than improved overall classification.
Recall for irrelevant comments dropped notably in unbalanced datasets, which indicates an introduced bias. For the balanced dataset, the SVM model achieved a recall of 0.65 for class 0 (irrelevant comments), while for the imbalanced dataset, this dropped significantly to 0.44. Similarly, the Logistic Regression model's recall for class 0 decreased from 0.70 in the balanced dataset to 0.46 in the imbalanced dataset.
Interestingly, while recall decreased, precision remained relatively stable across both balanced and imbalanced datasets. The F1 score was however affected by the decline in recall. This suggests that when faced with an imbalanced dataset, both models struggled to correctly identify irrelevant comments, potentially misclassifying them as relevant.
5.3.2 Choice of model
In conclusion, while both SVM and Logistic Regression models demonstrated acceptable performance on the balanced dataset, the introduction of class imbalance significantly impacted their ability to correctly identify irrelevant comments. Undersampling the positive samples was beneficial for improving recall and general model performance, particularly for the current task where the emphasis was on successfully filtering out the minority class.
The Support Vector Machine (SVM) model was selected due to its slightly higher classification accuracy and high precision in correctly classifying irrelevant samples. Priority was placed on ensuring dataset quality, and SVM is a common choice for binary classification tasks (Ahmad, 2017).
6Sample classification
To represent the three companies, three models were independently trained using TF-IDF and balanced training set. The trained models were used to classify the rest of the samples for the chosen periods of interest regarding a specific company.
The models generated a non-binary relevance score, and a threshold of 0.8 was established for converting to binary classification. A relatively high threshold was chosen in order to maintain a high level of confidence in the sentiment analysis results - samples with relevance scores below this threshold were discarded from further analysis.
 Table 9. Details on company-specific datasets after preprocessing.
On average, 50.4% of samples were excluded during the preprocessing and classification stages. This exclusion rate was similar to the labeling performed by the LLMs during sampling, with some notable variation for the Apple model (see Figure 10).
This suggests there might be some overfitting in the training data, potentially since Apple's dataset was the smallest, and the model failed to generalize when introduced to new data. The word "apple" has multiple meanings, which reduces the number of samples available for creating a balanced training dataset.
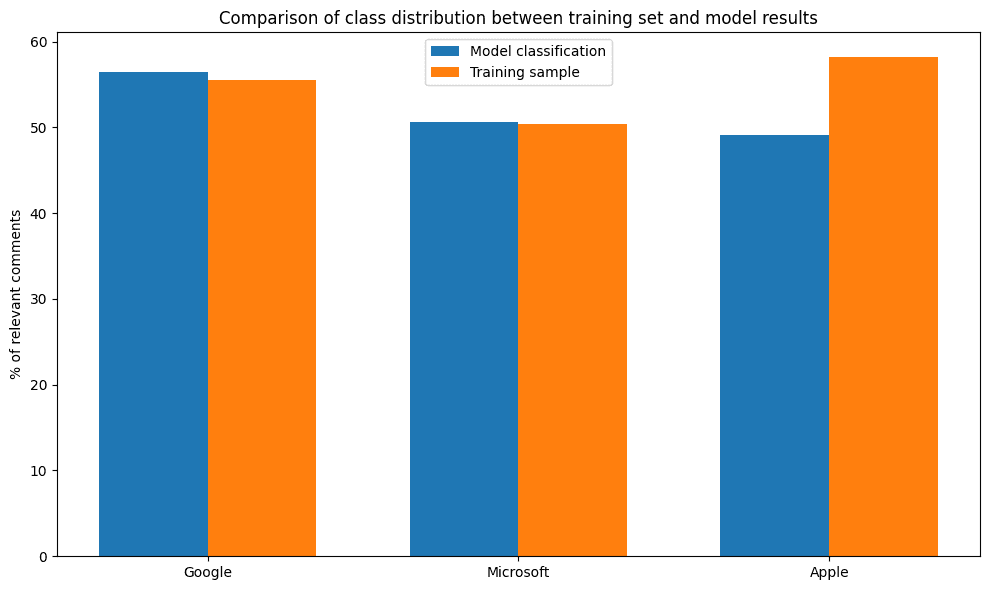 Figure 10. Comparison of class distribution between training set and model results.
The overall process produced an average of 1,882 relevant comments per week for Google, 1,628 for Apple, and 478 for Microsoft, with noticeable differences in weekly representation (see Figure 11).
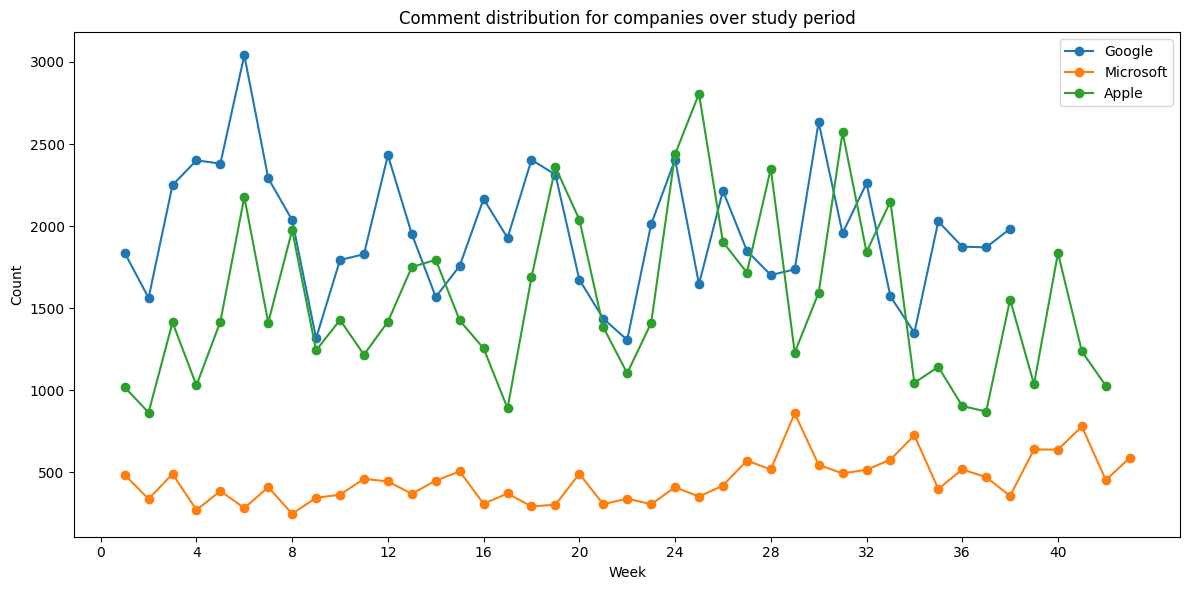 Figure 11. Comment distribution for companies over individual periods of study.
7Sentiment analysis
Samples deemed confident by the classification models were selected for subsequent sentiment analysis. The sentiment analysis was conducted using a BERT-based model called "bertweet-base-sentiment-analysis". This model is a fine-tuned version of BERTweet, a RoBERTa model pre-trained on a corpus of 850 million English tweets (Hugging Face, n.d.).
The selection of this particular model was motivated by the structural and linguistic similarities between Twitter posts ("tweets") and the content present in our dataset. The model's pre-training on a large corpus of social media text makes it well-suited for analyzing the style of short-form writing and potentially ambiguous sentiment that is expected in this dataset (Nguyen, Vu, & Nguyen, 2020).
At this stage, the dataset was normalized following the original guidelines from BERTweet to optimize model performance (VinAI Research, n.d.). This normalization process included converting URLs from their current format, such as "(link)", to "HTTPURL", which is the format the model was trained on.
7.1Sentiment analysis results
The model results categorized sentiment into positive, negative, and neutral, along with corresponding respective confidence scores. Notably, neutral sentiment was the most prevalent among the results (see Table 10).
 Table 10. Distribution of sentiment classification for Apple, Google and Microsoft.
Given that the dataset centers on prominent technology firms like Google, Microsoft, and Apple, the generally negative sentiment was not surprising. These companies often face high scrutiny, and controversy due to their actions and market control, leading to critical public discourse.
Confidence scores from the sentiment analysis model were utilized to weigh the results. Although the overall range of sentiment was narrow (weekly maximum deviation of ±0.15 from the mean) for all companies, the standard deviation indicated relatively high variability in daily sentiment scores (see Figure 12). Visualizations often employ a smoothed graph (n=7) to better illustrate the rolling average.
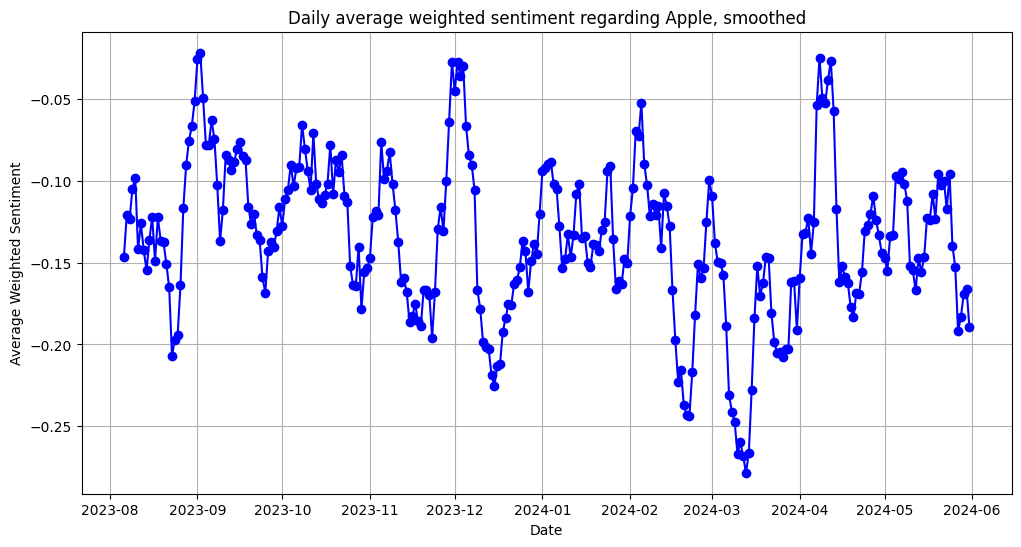 Figure 12. Daily smoothed average of w eighted sentiment scores for Apple between August 2023 and June 2024.
 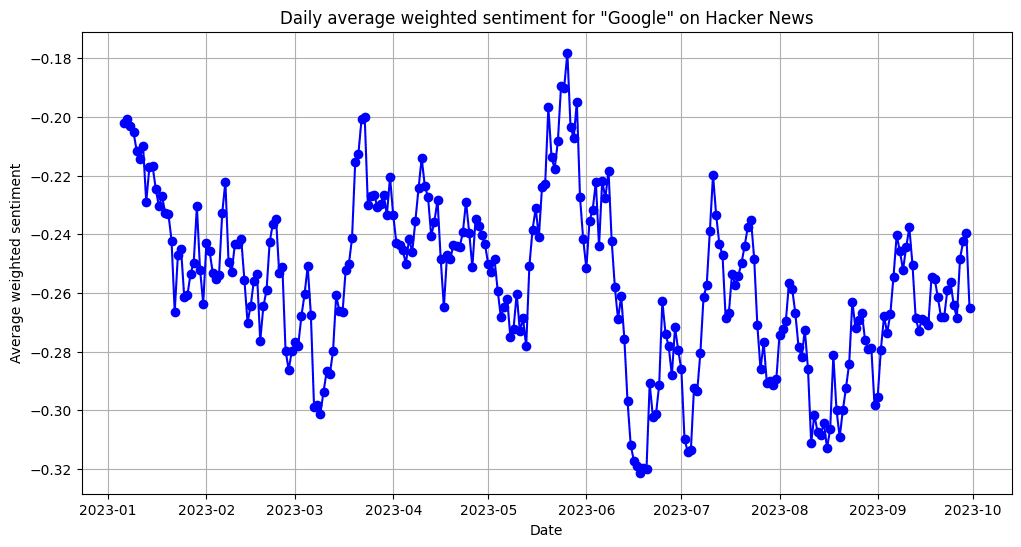 Figure 13. Daily smoothed average of w eighted sentiment scores for Google between January 2023 and October 2023.
 7.2Effects of news headlines
The analysis revealed notable drops in sentiment. Observable correlations were found between spikes in daily comment counts and a decline in average sentiment values (see Figure 14). This indicates that sudden changes in sentiment could likely be linked to specific trending articles or headlines with negative undertones.
For Google, which emerged as the most negatively perceived company in this study, increased comment activity often coincided with lower sentiment scores, while periods of fewer mentions trended towards neutrality. Similar trends were noted for Apple, where increased comment activity also correlated with a drop in sentiment (see Figure 15). These findings suggest that both companies are sensitive to the tone of news headlines.
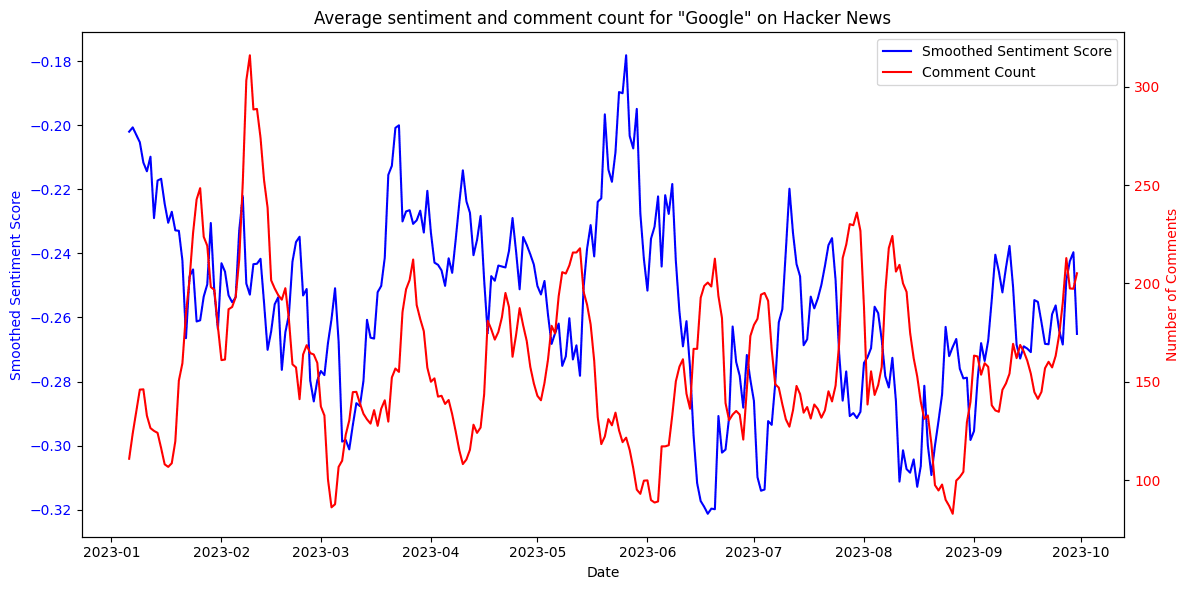 Figure 14. Average sentiment compared to number of comments mentioning Google.
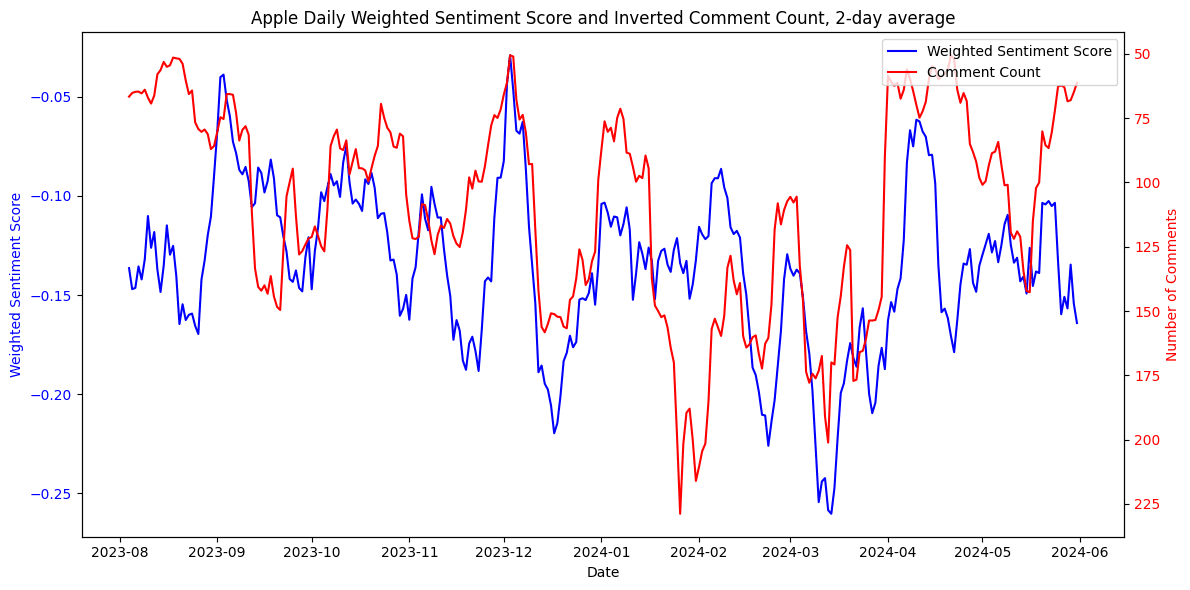 Figure 15. Average sentiment compared to number of comments mentioning Apple. Number of comments are represented on an inverted y-axis.
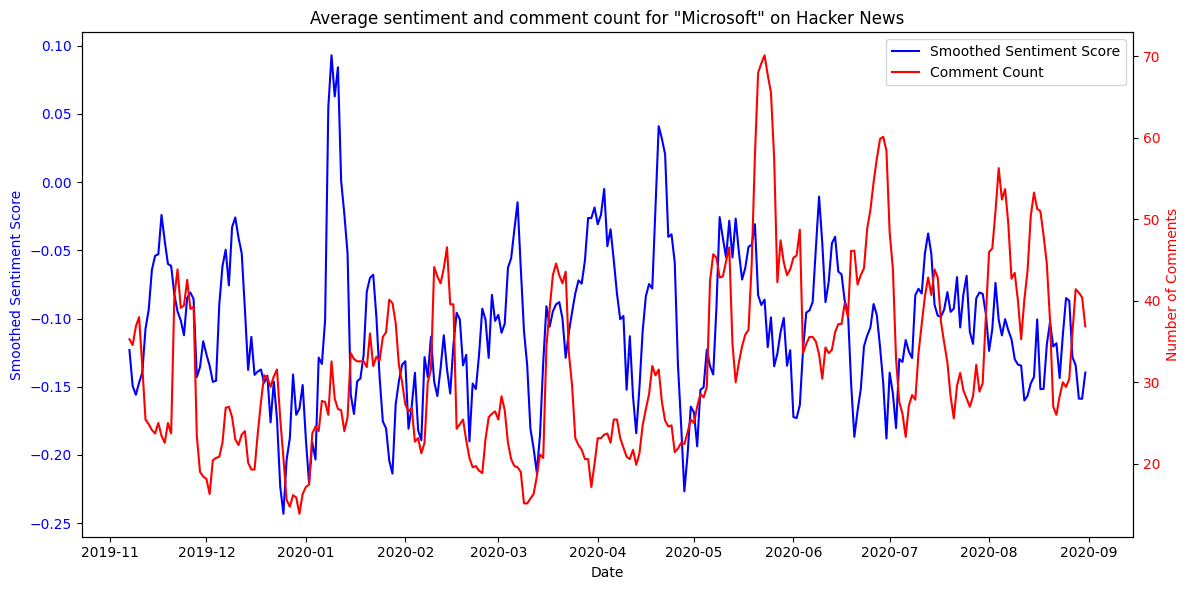 Figure 16. Average sentiment compared to number of comments mentioning Microsoft.
This negative correlation was less notable for Microsoft. Going forward, the notably smaller number of comments for Microsoft presented an interesting challenge - assessing whether the effect of individual events would bear too much weight on company-related sentiment regarding a dataset of this size.
8Results
Stock prices for the companies in focus were retrieved from Nasdaq. These prices were visualized based on the closing price, smoothed per rolling week to match the smoothed representation of sentiment.
The sentiment and stock changes were first visualized on a double y-axis. Upon visual inspection, the volatility in sentiment change could at times be perceived as both predictive of short-term market movements and reactive to ongoing events, with different companies exhibiting largely different trends.
Correlations were therefore calculated for different time periods, splitting the time series data in two. Four shifts were introduced, comparing the closing price 1 and 2 weeks before and after real time sentiment change. Correlation coefficients were calculated using the Pearson, Spearman and Kendall methods to get a better overview. Full table of results can be found in Appendix C.
8.1Microsoft
In the chosen period of study for Microsoft, the company stock was growing rapidly. However, the rolling average growth percentage for Microsoft was often trending in the opposite direction of sentiment changes (see Figure 17). No visual correlation with sentiment change could be discerned (see Figure 18).
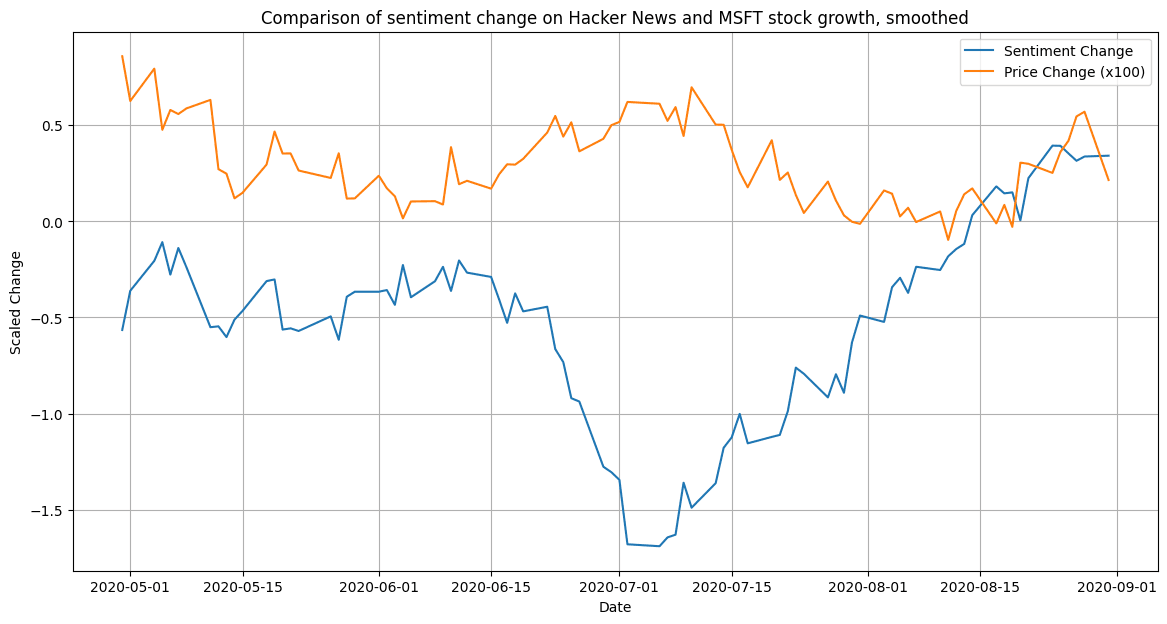 Figure 17. Comparison of sentiment change on Hacker News and MSFT stock growth.
General correlation was weak across all shifts and time periods, resulting in an average correlation of -0.067. Highest correlation coefficient could be identified for the second half of the study period, where a negative correlation of -0.19 was observed with a stock price delay of one week (-7 days), indicating a slight reaction to the general market.
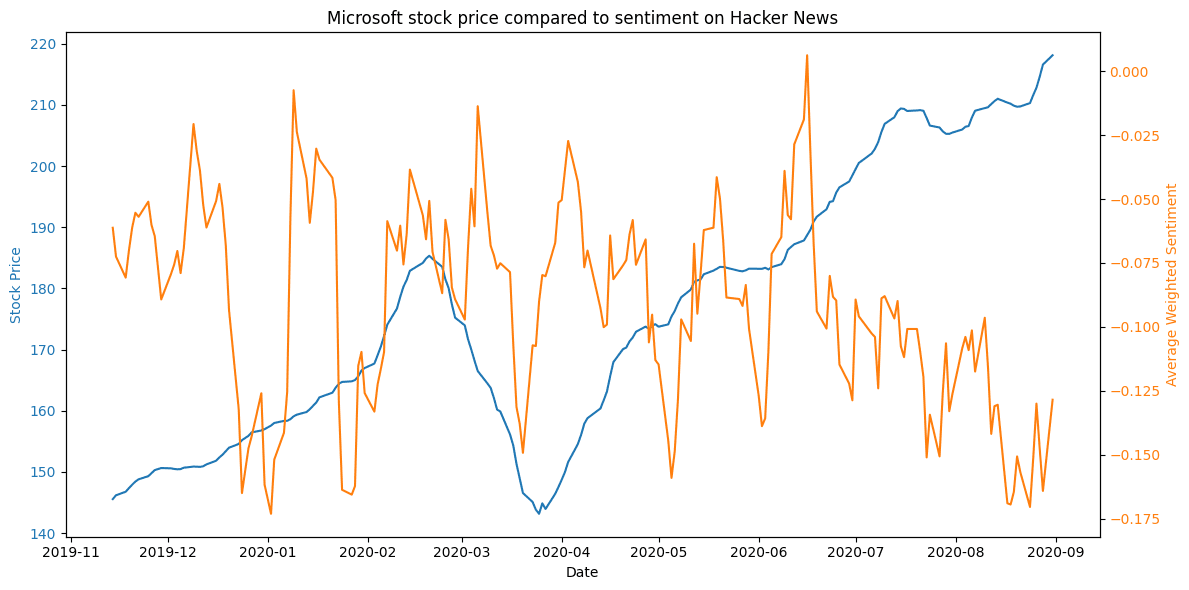 Figure 18. Microsoft stock price compared to sentiment on Hacker News.
A potential source of low causality could be the significantly smaller dataset for Microsoft, causing the sentiment to react strongly to news articles, and fluctuate based on the sentiment expressed in the headlines. This suggests more data would be necessary to accurately describe the potential relationship between the stock price and sentiment.
8.2Google
For Google, the movement of both metrics follow wave-like patterns. Although the general behavior for the stock during this period has followed an upwards trend, the more volatile change patterns of Hacker News sentiment sometimes precede the direction change trends of the stock. For this period under study, a sharp rise or fall of Hacker News sentiment could be seen as a precursor for stock price adjustments.
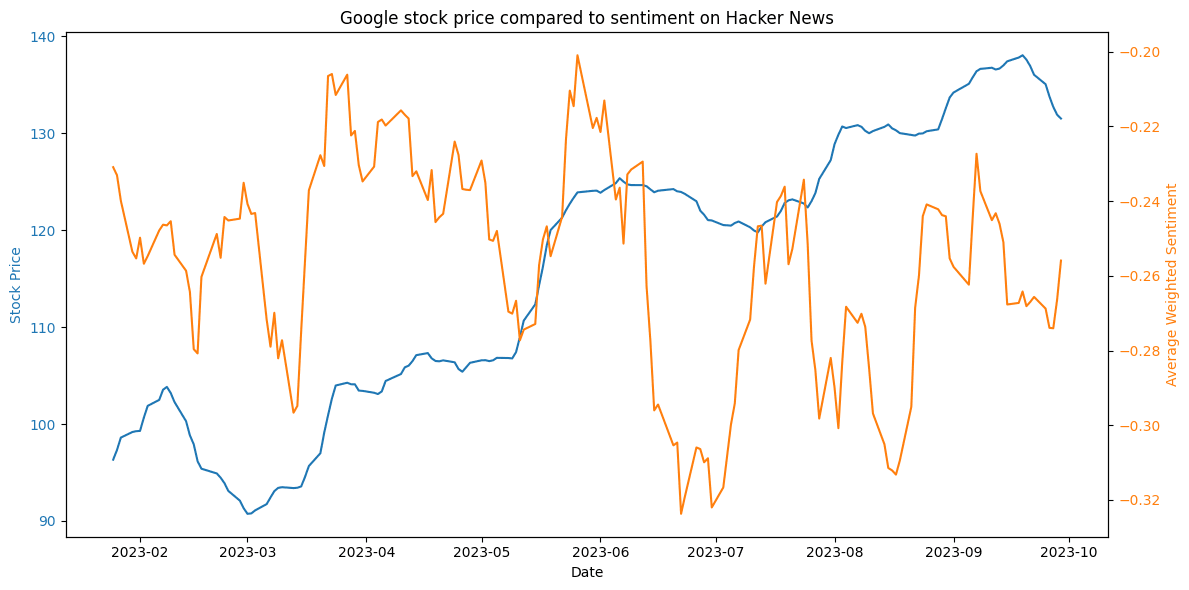 Figure 19. Google stock price compared to sentiment on Hacker News.
Although this change for both metrics is likely to be triggered by the same news, significant stock growth was often led by a change in Hacker News sentiment 1-4 weeks prior (see Figure 19).
Upon examining the coefficients for this time period, many of the evaluated coefficients are close to zero, indicating no discernible relationship between sentiment and stock price with different time lags. However, from May to October 2023, there are weak positive correlations (Spearman: 0.21; Pearson: 0.20; Kendall: 0.14) with a week's advance (+7 day shift). This suggests a slight predictive relationship, where sentiment might predict stock price increases with a short advance.
Notably, while the coefficient's average in the second half of the study for a weekly prediction was 0.18, the first half of the study featured a negative correlation with an average coefficient of -0.11. Although both correlations are weak, this shift could be seen as indicative that the relationship changes over time, and cannot be generalized outside of this period of study.
8.3Apple
For Apple stock, this was a period of volatility. Upon visual inspection, a notable (temporary) drop in sentiment in March 2024 is followed by a stark drop in stock price, which also recovers similarly to the sentiment. The correlation coefficients are again compared in two intervals, July to December 2023 and December to May 2024.
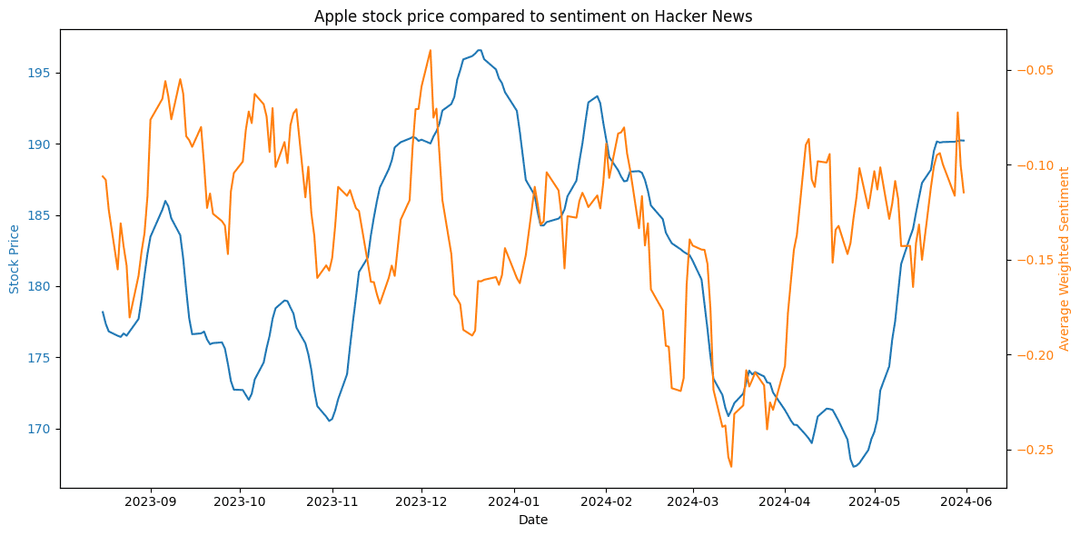 Figure 20. Apple stock price compared to sentiment on Hacker News.
Figure 21 showcases the stock-sentiment correlation for Apple in late 2023. Sentiment seems to follow market reactions, being either on par or 1-2 weeks behind the significant changes, such as the stock price surge at the end of the year.
This is on par with coefficient analysis, where both the Pearson and Spearman correlations indicate a slight inverse relationship with a week's advance (+7 days) - coefficient values -0.22 and -0.19 respectively. This suggests that in the second half of 2023, sentiment decrease was indicative of a potential rise in stock prices.
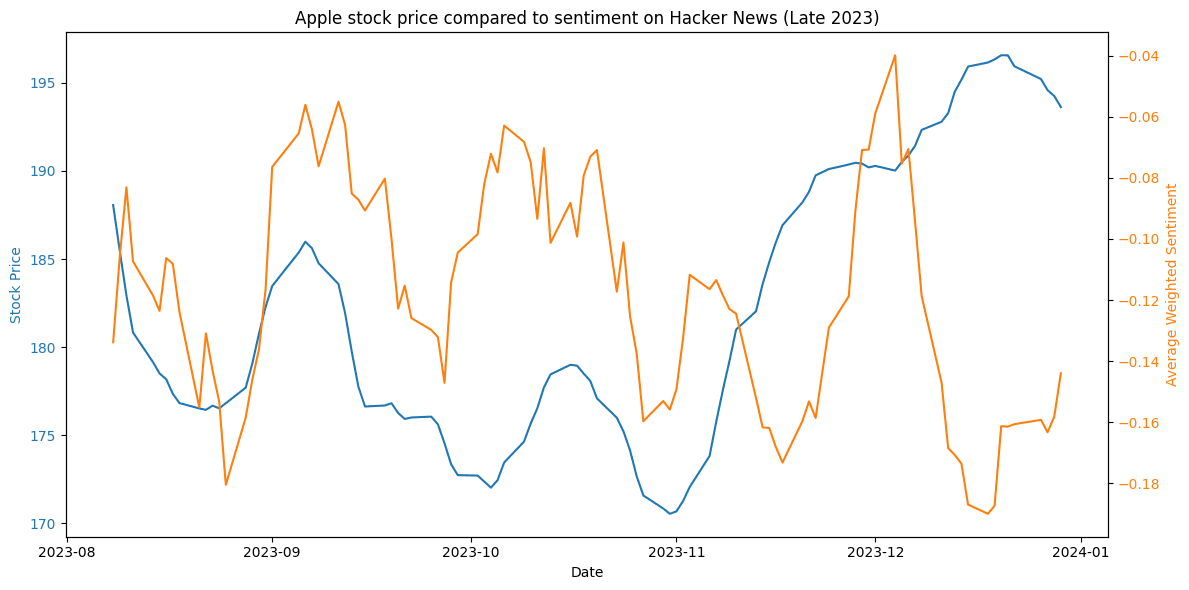 Figure 21. Comparison of sentiment and market trends for Apple in late 2023.
Conversely, from December to May 2024, there is a notable shift to a positive predictive correlation. With a +14 days shift, Spearman and Pearson correlations indicate 0.26 and 0.22 respectively. In Figure 22, average sentiment is seen to decrease before the market follows the same trend, and also recover significantly faster. Figure 23 visually confirms that a 2-week shift for stock prices aligns with the sentiment trend during that same period, supporting the results of the coefficient study.
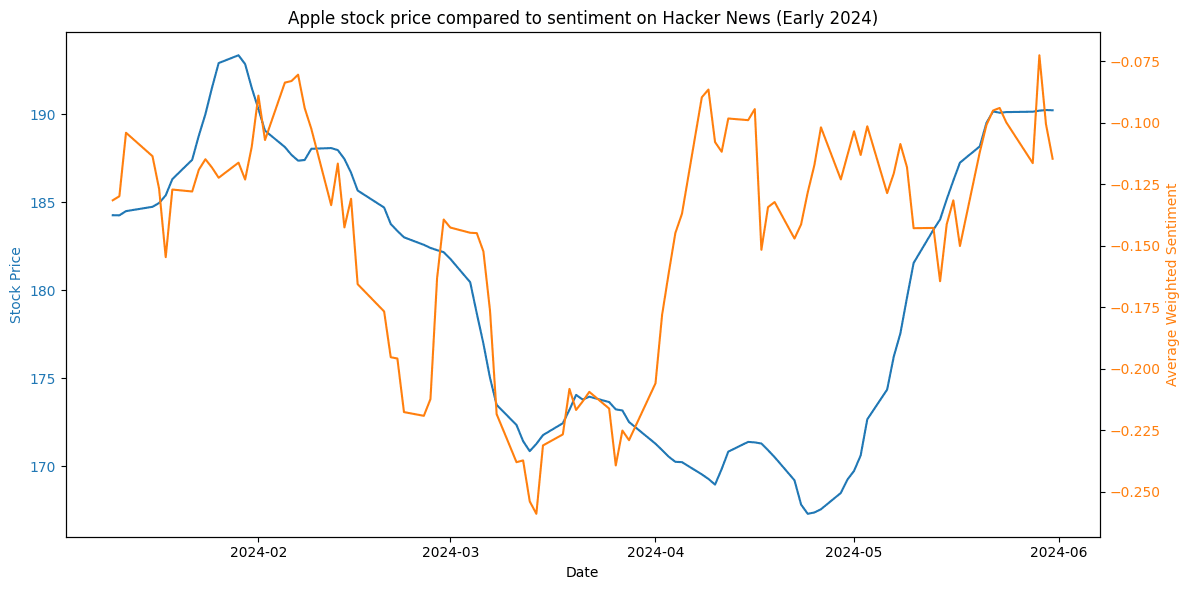 Figure 22. Comparison of sentiment and market trends for Apple in early 2024.
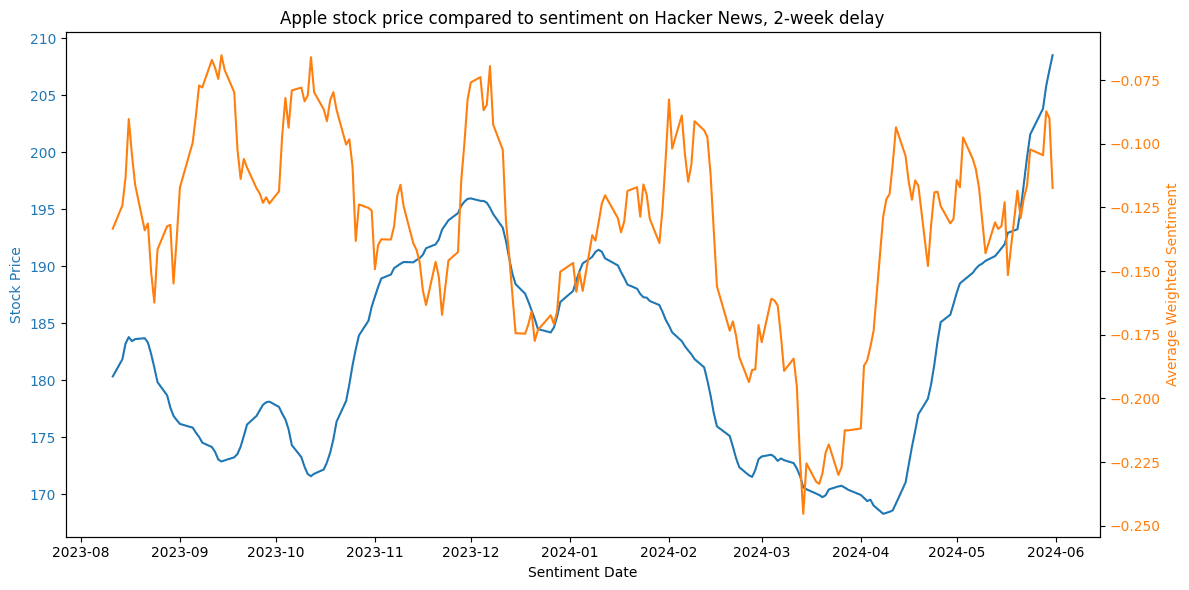 Figure 23. Comparison of sentiment and market trends for Apple in early 2024. A two-week delay is introduced for depicting stock prices.
The reactions appeared to correlate with market trends, yet notably did not surpass a certain baseline threshold significantly, as already noted in the previous section. The intermediary volatility in sentiment change could be perceived as both predictive of short-term market movements and reactive to ongoing events.
As the average sentiment did not deviate significantly over these study periods, introducing more lag in comparing Hacker News sentiment with the stock price produced no notable results. This refutes the hypothesis that Hacker News could significantly predict or foresee market performance.
9Conclusion
This thesis explored whether sentiment expressed on Hacker News could predict mid-term market performance of relevant technology companies. The findings suggest that Hacker News sentiment is not a reliable predictor of long-term stock valuation. Introducing a lag in comparing Hacker News sentiment and the stock market did not yield stable results, as found correlations were inconsistent and changed over time.
Although there were periods where sentiment changes appeared to precede stock price movements, particularly for Google and Apple, these correlations were weak and inconsistent. The relationship between sentiment and stock prices varied across different companies and time frames, with some periods showing positive correlations, others negative or none at all. This variability indicates that Hacker News sentiment does not have a stable or significant predictive power for mid-term stock market performance.
It is worth noting that the study focused on limited time periods, and further study would be needed to determine whether these findings, as well as the low deviation in average sentiments, hold true over different periods of time. However, current variability in results suggests that the complexity of stock market dynamics requires a more comprehensive approach, incorporating multiple data sources and analytical methods, to effectively predict market movements.
Citations
Ahmad, M., Aftab, S., & Ali, I. (2017). Sentiment analysis of tweets using svm. Int. J. Comput. Appl, 177(5), 25-29.
Algolia. (n.d.). HN Search powered by Algolia. Retrieved from https://hn.algolia.com/api
Arora, S. D., Singh, G. P., Chakraborty, A., & Maity, M. (2022). Polarization and social media: A systematic review and research agenda. Technological Forecasting and Social Change, 183, 121942. https://doi.org/10.1016/j.techfore.2022.121942
Bollen, J., Mao, H., & Zeng, X. (2011). Twitter mood predicts the stock market. Journal of computational science, 2(1), 1-8. https://doi.org/10.1016/j.jocs.2010.12.007.
Brown, T. B. (2020). Language models are few-shot learners. arXiv preprint arXiv:2005.14165.
Cinelli, M., De Francisci Morales, G., Galeazzi, A., Quattrociocchi, W., & Starnini, M. (2021). The echo chamber effect on social media. Proceedings of the National Academy of Sciences, 118(9), e2023301118. Https://doi.org/10.1073/pnas.2023301118
DATAtab. (2024). Kendall's Tau: Simply explained. DATAtab e.U. Graz, Austria. Retrieved from https://datatab.net/tutorial/kendalls-tau
DATAtab. (2024). Spearman Correlation: Simply explained. DATAtab e.U. Graz, Austria. Retrieved from https://datatab.net/tutorial/spearman-correlation
DATAtab. (2024). Pearson Correlation: Simply explained. DATAtab e.U. Graz, Austria. Retrieved from https://datatab.net/tutorial/pearson-correlation
De Francisci Morales, G. D. F., Monti, C., & Starnini, M. (2021). No echo in the chambers of political interactions on Reddit. Scientific Reports, 11(1), 2818. https://doi.org/10.1038/s41598-021-81531-x
Deng, X., Bashlovkina, V., Han, F., Baumgartner, S., & Bendersky, M. (2023, April). Llms to the moon? reddit market sentiment analysis with large language models. In Companion Proceedings of the ACM Web Conference 2023 (pp. 1014-1019).
Devlin, J. (2018). Bert: Pre-training of deep bidirectional transformers for language understanding. arXiv preprint arXiv:1810.04805.
Du, K., Xing, F., Mao, R., & Cambria, E. (2024). Financial sentiment analysis: Techniques and applications. ACM Computing Surveys, 56(9), 1-42.
Fang, Z., Lu, J., Liu, F., & Zhang, G. (2022). Semi-supervised heterogeneous domain adaptation: Theory and algorithms. IEEE Transactions on Pattern Analysis and Machine Intelligence, 45(1), 1087-1105. https://doi.org/10.1109/TPAMI.2022.3146234
Feng, L., Tung, F., Ahmed, M. O., Bengio, Y., & Hajimirsadegh, H. (2024). Were RNNs All We Needed?. arXiv preprint arXiv:2410.01201.
Gupta, S., Ranjan, R., & Singh, S. N. (2024). Comprehensive Study on Sentiment Analysis: From Rule-based to modern LLM based system. arXiv preprint arXiv:2409.09989.
Gupta, S., Ranjan, R., & Singh, S. N. (2024). Comprehensive Study on Sentiment Analysis: From Rule-based to modern LLM based system. arXiv preprint arXiv:2409.09989.
Guresen, E., & Kayakutlu, G. (2011). Definition of artificial neural networks with comparison to other networks. Procedia Computer Science, 3, 426-433. https://doi.org/10.1016/j.procs.2010.12.071
finiteautomata/bertweet-base-sentiment-analysis · Hugging Face. (n.d.). Hugging Face. Retrieved September 26, 2024, from https://huggingface.co/finiteautomata/bertweet-base-sentiment-analysis
distilbert/distilbert-base-uncased · Hugging Face. (2024, March 11). Hugging Face. Retrieved October 2, 2024, from https://huggingface.co/distilbert/distilbert-base-uncased
IBM. (n.d.) Neural Networks. Retrieved from https://www.ibm.com/topics/neural-networks
IBM. (n.d.). Decision trees. Retrieved from https://www.ibm.com/topics/decision-trees
IBM. (n.d.). Naive Bayes. Retrieved from https://www.ibm.com/topics/naive-bayes
IBM. (n.d.). Support Vector Machine. Retrieved from https://www.ibm.com/topics/support-vector-machine
Jurafsky, D., & Martin, J. H. (2024). Speech and language processing (Draft of August 20, 2024). Chapter 5: Logistic Regression. Retrieved from https://web.stanford.edu/~jurafsky/slp3/5.pdf
Ma, Y., Peng, H., Khan, T., Cambria, E., & Hussain, A. (2018). Sentic LSTM: a hybrid network for targeted aspect-based sentiment analysis. Cognitive Computation, 10, 639-650.
Mardassa, B., Beza, A., Madhan, A. A., & Aldwairi, M. (2024). Sentiment analysis of hacker forums with deep learning to predict potential cyberattacks. In 2024 15th Annual Undergraduate Research Conference on Applied Computing (URC) (pp. 1-6). IEEE. https://doi.org/10.1109/URC62276.2024.10604548
Mittal, A., & Goel, A. (2012). Stock prediction using twitter sentiment analysis. Standford University, CS229 (2011 http://cs229. stanford. edu/proj2011/GoelMittal-StockMarketPredictionUsingTwitterSentimentAnalysis. pdf), 15, 2352.
Nasdaq. (n.d.). Alphabet Inc. (GOOGL) historical data. Nasdaq. Retrieved September 19, 2024, from https://www.nasdaq.com/market-activity/stocks/googl/historical
Nasdaq. (n.d.). Apple Inc. (AAPL) historical data. Nasdaq. Retrieved September 19, 2024, from https://www.nasdaq.com/market-activity/stocks/aapl/historical
Nasdaq. (n.d.). Microsoft Corporation (MSFT) historical data. Nasdaq. Retrieved September 19, 2024, from https://www.nasdaq.com/market-activity/stocks/msft/historical
Natekin, A., & Knoll, A. (2013). Gradient boosting machines, a tutorial. Frontiers in neurorobotics, 7, 21. https://doi.org/10.3389/fnbot.2013.00021
Nguyen, D. Q., Vu, T., & Nguyen, A. T. (2020). BERTweet: A pre-trained language model for English Tweets. arXiv preprint arXiv:2005.10200.
Nowak, J., Taspinar, A., & Scherer, R. (2017). LSTM recurrent neural networks for short text and sentiment classification. In Artificial Intelligence and Soft Computing: 16th International Conference, ICAISC 2017, Zakopane, Poland, June 11-15, 2017, Proceedings, Part II 16 (pp. 553-562). Springer International Publishing.
OpenAI. (n.d.). Batch processing overview. OpenAI. https://platform.openai.com/docs/guides/batch/overview
Peng, B., Li, C., He, P., Galley, M., & Gao, J. (2023). Instruction tuning with gpt-4. arXiv preprint arXiv:2304.03277.
Rahman Jim, J., Talukder, M. A. R., Malakar, P., Kabir, M. M., Nur, K., & Mridha, M. F. (2024). Recent advancements and challenges of NLP-based sentiment analysis: A state-of-the-art review. Natural Language Processing Journal, 6, 100059. https://doi.org/10.1016/j.nlp.2024.100059
Salihefendic, A. (2015, December 8). How Hacker News ranking algorithm works. Hacking and Gonzo. https://medium.com/hacking-and-gonzo/how-hacker-news-ranking-algorithm-works-1d9b0cf2c08d
Sanh, V. (2019). DistilBERT, A Distilled Version of BERT: Smaller, Faster, Cheaper and Lighter. arXiv preprint arXiv:1910.01108.
Si, J., Mukherjee, A., Liu, B., Li, Q., Li, H., & Deng, X. (2013, August). Exploiting topic based twitter sentiment for stock prediction. In Proceedings of the 51st Annual Meeting of the Association for Computational Linguistics (Volume 2: Short Papers) (pp. 24-29).
Stoddard, G. (2021). Popularity dynamics and intrinsic quality in Reddit and Hacker News. Proceedings of the International AAAI Conference on Web and Social Media, 9(1), 416-425. https://doi.org/10.1609/icwsm.v9i1.14636
Vaswani, A., Shazeer, N., Parmar, N., Uszkoreit, J., Jones, L., Gomez, A. N., Kaiser, Ł., & Polosukhin, I. (2023). Attention is all you need. arXiv. https://arxiv.org/abs/1706.03762
VinAI Research. (n.d.). BERTweet. GitHub. Retrieved October 12, 2024, from https://github.com/VinAIResearch/BERTweet
Wankhade, M., Rao, A. C. S., & Kulkarni, C. (2022). A survey on sentiment analysis methods, applications, and challenges. Artificial Intelligence Review, 55, 5731-5780. https://doi.org/10.1007/s10462-022-10144-1
Zhang, W., Deng, Y., Liu, B., Pan, S. J., & Bing, L. (2023). Sentiment analysis in the era of large language models: A reality check. arXiv preprint arXiv:2305.15005.
Appendix
A.Figures used in determining volatile periods
A.1 Yearly stock growth comparison (2020)
A.2 Yearly stock growth comparison (2021)
A.3 Yearly stock growth comparison (2023)
B.Table of LLM prompts
Task | Dataset | Prompt |
Classification sampling | Microsoft | Task: Classify comments for relevance to sentiment analysis on Microsoft. Instructions:
Example:
Response: {"1": "yes", "2": "no", "3": "yes"} Remember to respond in a json format with ONLY "yes" or "no" for each comment, based on its relevance to sentiment analysis for Microsoft. |
Classification sampling | Task: Classify comments for relevance to sentiment analysis on Google. Instructions:
Example:
Response: {"1": "yes", "2": "no"} Remember to respond in a json format with ONLY "yes" or "no" for each comment, based on its relevance to sentiment analysis for Google. | |
Classification sampling | Apple | Task: Classify comments for relevance to sentiment analysis on Apple (the company). Instructions:
Example:
Response: {"1": "yes", "2": "no", "3": "yes"} Remember to respond in a json format with ONLY "yes" or "no" for each comment, based on its relevance to sentiment analysis for Apple (the company). |
C.Table of stock-sentiment correlations
Price shift (days) | Correlation coefficient | Method | Period | Company |
+14 | -0.13 | spearman | 07/31/2023:12/30/2023 | Apple |
+14 | -0.11 | pearson | 07/31/2023:12/30/2023 | Apple |
+14 | -0.09 | kendall | 07/31/2023:12/30/2023 | Apple |
+14 | 0.26 | spearman | 12/30/2023:05/31/2024 | Apple |
+14 | 0.22 | pearson | 12/30/2023:05/31/2024 | Apple |
+14 | 0.17 | kendall | 12/30/2023:05/31/2024 | Apple |
+7 | -0.22 | spearman | 07/31/2023:12/30/2023 | Apple |
+7 | -0.19 | pearson | 07/31/2023:12/30/2023 | Apple |
+7 | -0.15 | kendall | 07/31/2023:12/30/2023 | Apple |
+7 | 0.22 | spearman | 12/30/2023:05/31/2024 | Apple |
+7 | 0.17 | pearson | 12/30/2023:05/31/2024 | Apple |
+7 | 0.14 | kendall | 12/30/2023:05/31/2024 | Apple |
-7 | -0.1 | spearman | 07/31/2023:12/30/2023 | Apple |
-7 | -0.1 | pearson | 07/31/2023:12/30/2023 | Apple |
-7 | -0.07 | kendall | 07/31/2023:12/30/2023 | Apple |
-7 | 0.11 | spearman | 12/30/2023:05/31/2024 | Apple |
-7 | 0.09 | pearson | 12/30/2023:05/31/2024 | Apple |
-7 | 0.07 | kendall | 12/30/2023:05/31/2024 | Apple |
-14 | -0.12 | spearman | 07/31/2023:12/30/2023 | Apple |
-14 | -0.17 | pearson | 07/31/2023:12/30/2023 | Apple |
-14 | -0.08 | kendall | 07/31/2023:12/30/2023 | Apple |
-14 | -0.01 | spearman | 12/30/2023:05/31/2024 | Apple |
-14 | -0.04 | pearson | 12/30/2023:05/31/2024 | Apple |
-14 | -0.0 | kendall | 12/30/2023:05/31/2024 | Apple |
+14 | -0.03 | spearman | 01/03/2023:05/17/2023 | |
+14 | -0.05 | pearson | 01/03/2023:05/17/2023 | |
+14 | -0.02 | kendall | 01/03/2023:05/17/2023 | |
+14 | 0.05 | spearman | 05/17/2023:09/29/2023 | |
+14 | 0.02 | pearson | 05/17/2023:09/29/2023 | |
+14 | 0.03 | kendall | 05/17/2023:09/29/2023 | |
+7 | -0.05 | spearman | 01/03/2023:05/17/2023 | |
+7 | -0.08 | pearson | 01/03/2023:05/17/2023 | |
+7 | -0.03 | kendall | 01/03/2023:05/17/2023 | |
+7 | 0.21 | spearman | 05/17/2023:09/29/2023 | |
+7 | 0.2 | pearson | 05/17/2023:09/29/2023 | |
+7 | 0.14 | kendall | 05/17/2023:09/29/2023 | |
-7 | -0.13 | spearman | 01/03/2023:05/17/2023 | |
-7 | -0.08 | pearson | 01/03/2023:05/17/2023 | |
-7 | -0.09 | kendall | 01/03/2023:05/17/2023 | |
-7 | -0.15 | spearman | 05/17/2023:09/29/2023 | |
-7 | -0.12 | pearson | 05/17/2023:09/29/2023 | |
-7 | -0.09 | kendall | 05/17/2023:09/29/2023 | |
-14 | -0.13 | spearman | 01/03/2023:05/17/2023 | |
-14 | -0.11 | pearson | 01/03/2023:05/17/2023 | |
-14 | -0.09 | kendall | 01/03/2023:05/17/2023 | |
-14 | -0.05 | spearman | 05/17/2023:09/29/2023 | |
-14 | -0.13 | pearson | 05/17/2023:09/29/2023 | |
-14 | -0.03 | kendall | 05/17/2023:09/29/2023 | |
+14 | -0.12 | spearman | 11/01/2019:04/01/2020 | Microsoft |
+14 | -0.07 | pearson | 11/01/2019:04/01/2020 | Microsoft |
+14 | -0.08 | kendall | 11/01/2019:04/01/2020 | Microsoft |
+14 | -0.12 | spearman | 04/01/2020:08/31/2020 | Microsoft |
+14 | -0.12 | pearson | 04/01/2020:08/31/2020 | Microsoft |
+14 | -0.08 | kendall | 04/01/2020:08/31/2020 | Microsoft |
+7 | -0.03 | spearman | 11/01/2019:04/01/2020 | Microsoft |
+7 | 0.03 | pearson | 11/01/2019:04/01/2020 | Microsoft |
+7 | -0.02 | kendall | 11/01/2019:04/01/2020 | Microsoft |
+7 | -0.1 | spearman | 04/01/2020:08/31/2020 | Microsoft |
+7 | -0.13 | pearson | 04/01/2020:08/31/2020 | Microsoft |
+7 | -0.07 | kendall | 04/01/2020:08/31/2020 | Microsoft |
-7 | -0.03 | spearman | 11/01/2019:04/01/2020 | Microsoft |
-7 | 0.01 | pearson | 11/01/2019:04/01/2020 | Microsoft |
-7 | -0.02 | kendall | 11/01/2019:04/01/2020 | Microsoft |
-7 | -0.18 | spearman | 04/01/2020:08/31/2020 | Microsoft |
-7 | -0.19 | pearson | 04/01/2020:08/31/2020 | Microsoft |
-7 | -0.12 | kendall | 04/01/2020:08/31/2020 | Microsoft |
-14 | 0.03 | spearman | 11/01/2019:04/01/2020 | Microsoft |
-14 | 0.02 | pearson | 11/01/2019:04/01/2020 | Microsoft |
-14 | 0.02 | kendall | 11/01/2019:04/01/2020 | Microsoft |
-14 | -0.09 | spearman | 04/01/2020:08/31/2020 | Microsoft |
-14 | -0.1 | pearson | 04/01/2020:08/31/2020 | Microsoft |
-14 | -0.06 | kendall | 04/01/2020:08/31/2020 | Microsoft |
Berlin, 29.10.2024 |
